← Back to filtered projects

2026 Β· Personal Project

Niagara GPU Swarm System

A reusable GPU-agent framework built in Niagara for large-scale animated swarms, particle-level gameplay interaction, and responsive physical feedback.

Year
2026
Type
Personal Project
Role
Technical Artist / Niagara Systems Developer

Overview

What I built and why.

Originally developed to support the Dragon Rider prototype, this project grew from a single swarm effect into a reusable real-time agent framework. VAT animation, Neighbor Grid3D queries, particle-level damage, Render Target interactions, and a GPU-to-Blueprint handoff work together to keep large crowds lightweight while preserving readable hit and death responses.

System breakdown

How the swarm works

Four connected parts turn a Niagara effect into a reusable gameplay system: per-agent animation, spatial queries, damage interaction, and selective CPU handoff.

Learning referenceSeveral core techniques were developed from Ghislain Girardot's Niagara tutorials. I extended them into this project through the data protocol, gameplay logic, system integration, and profiling shown below. Ghislain Girardot β†—

01

Data-driven VAT animation

AnimToTexture bakes Idle, Walk, Hit, and Death. Each GPU agent selects a state, calculates its own playback frame, and sends that frame to the material through Dynamic Parameters.

  1. AnimToTexture
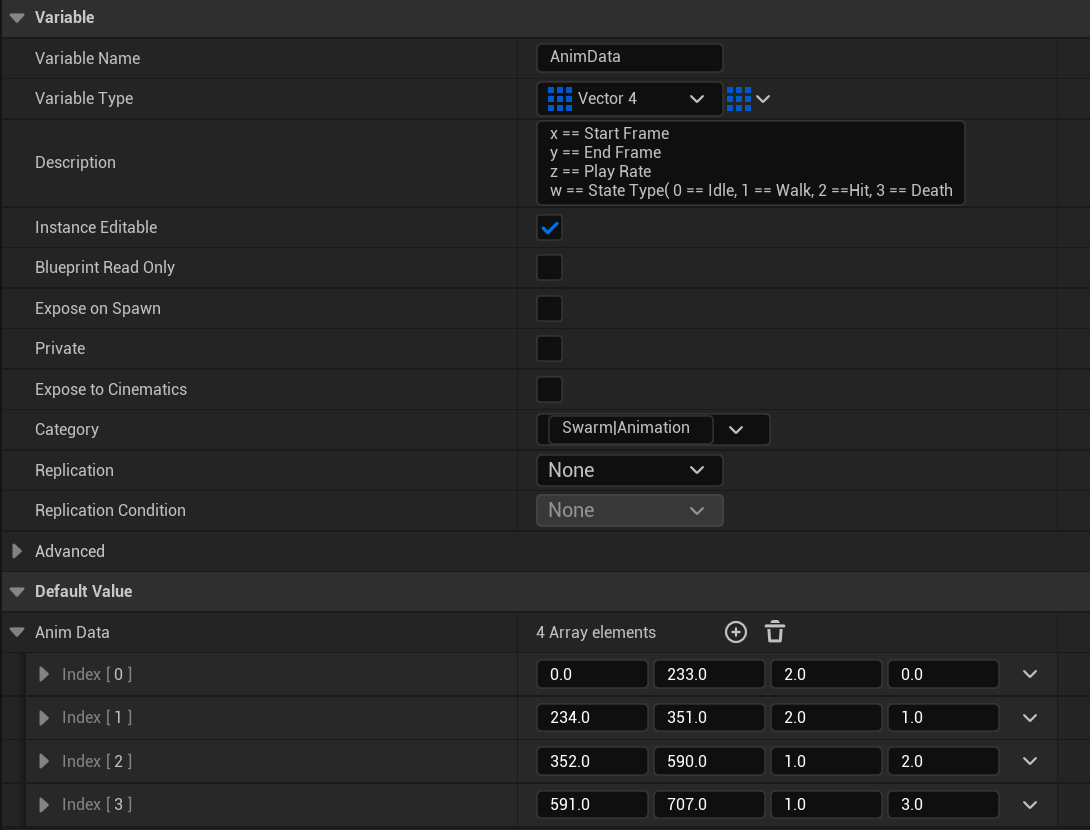
  2. State data
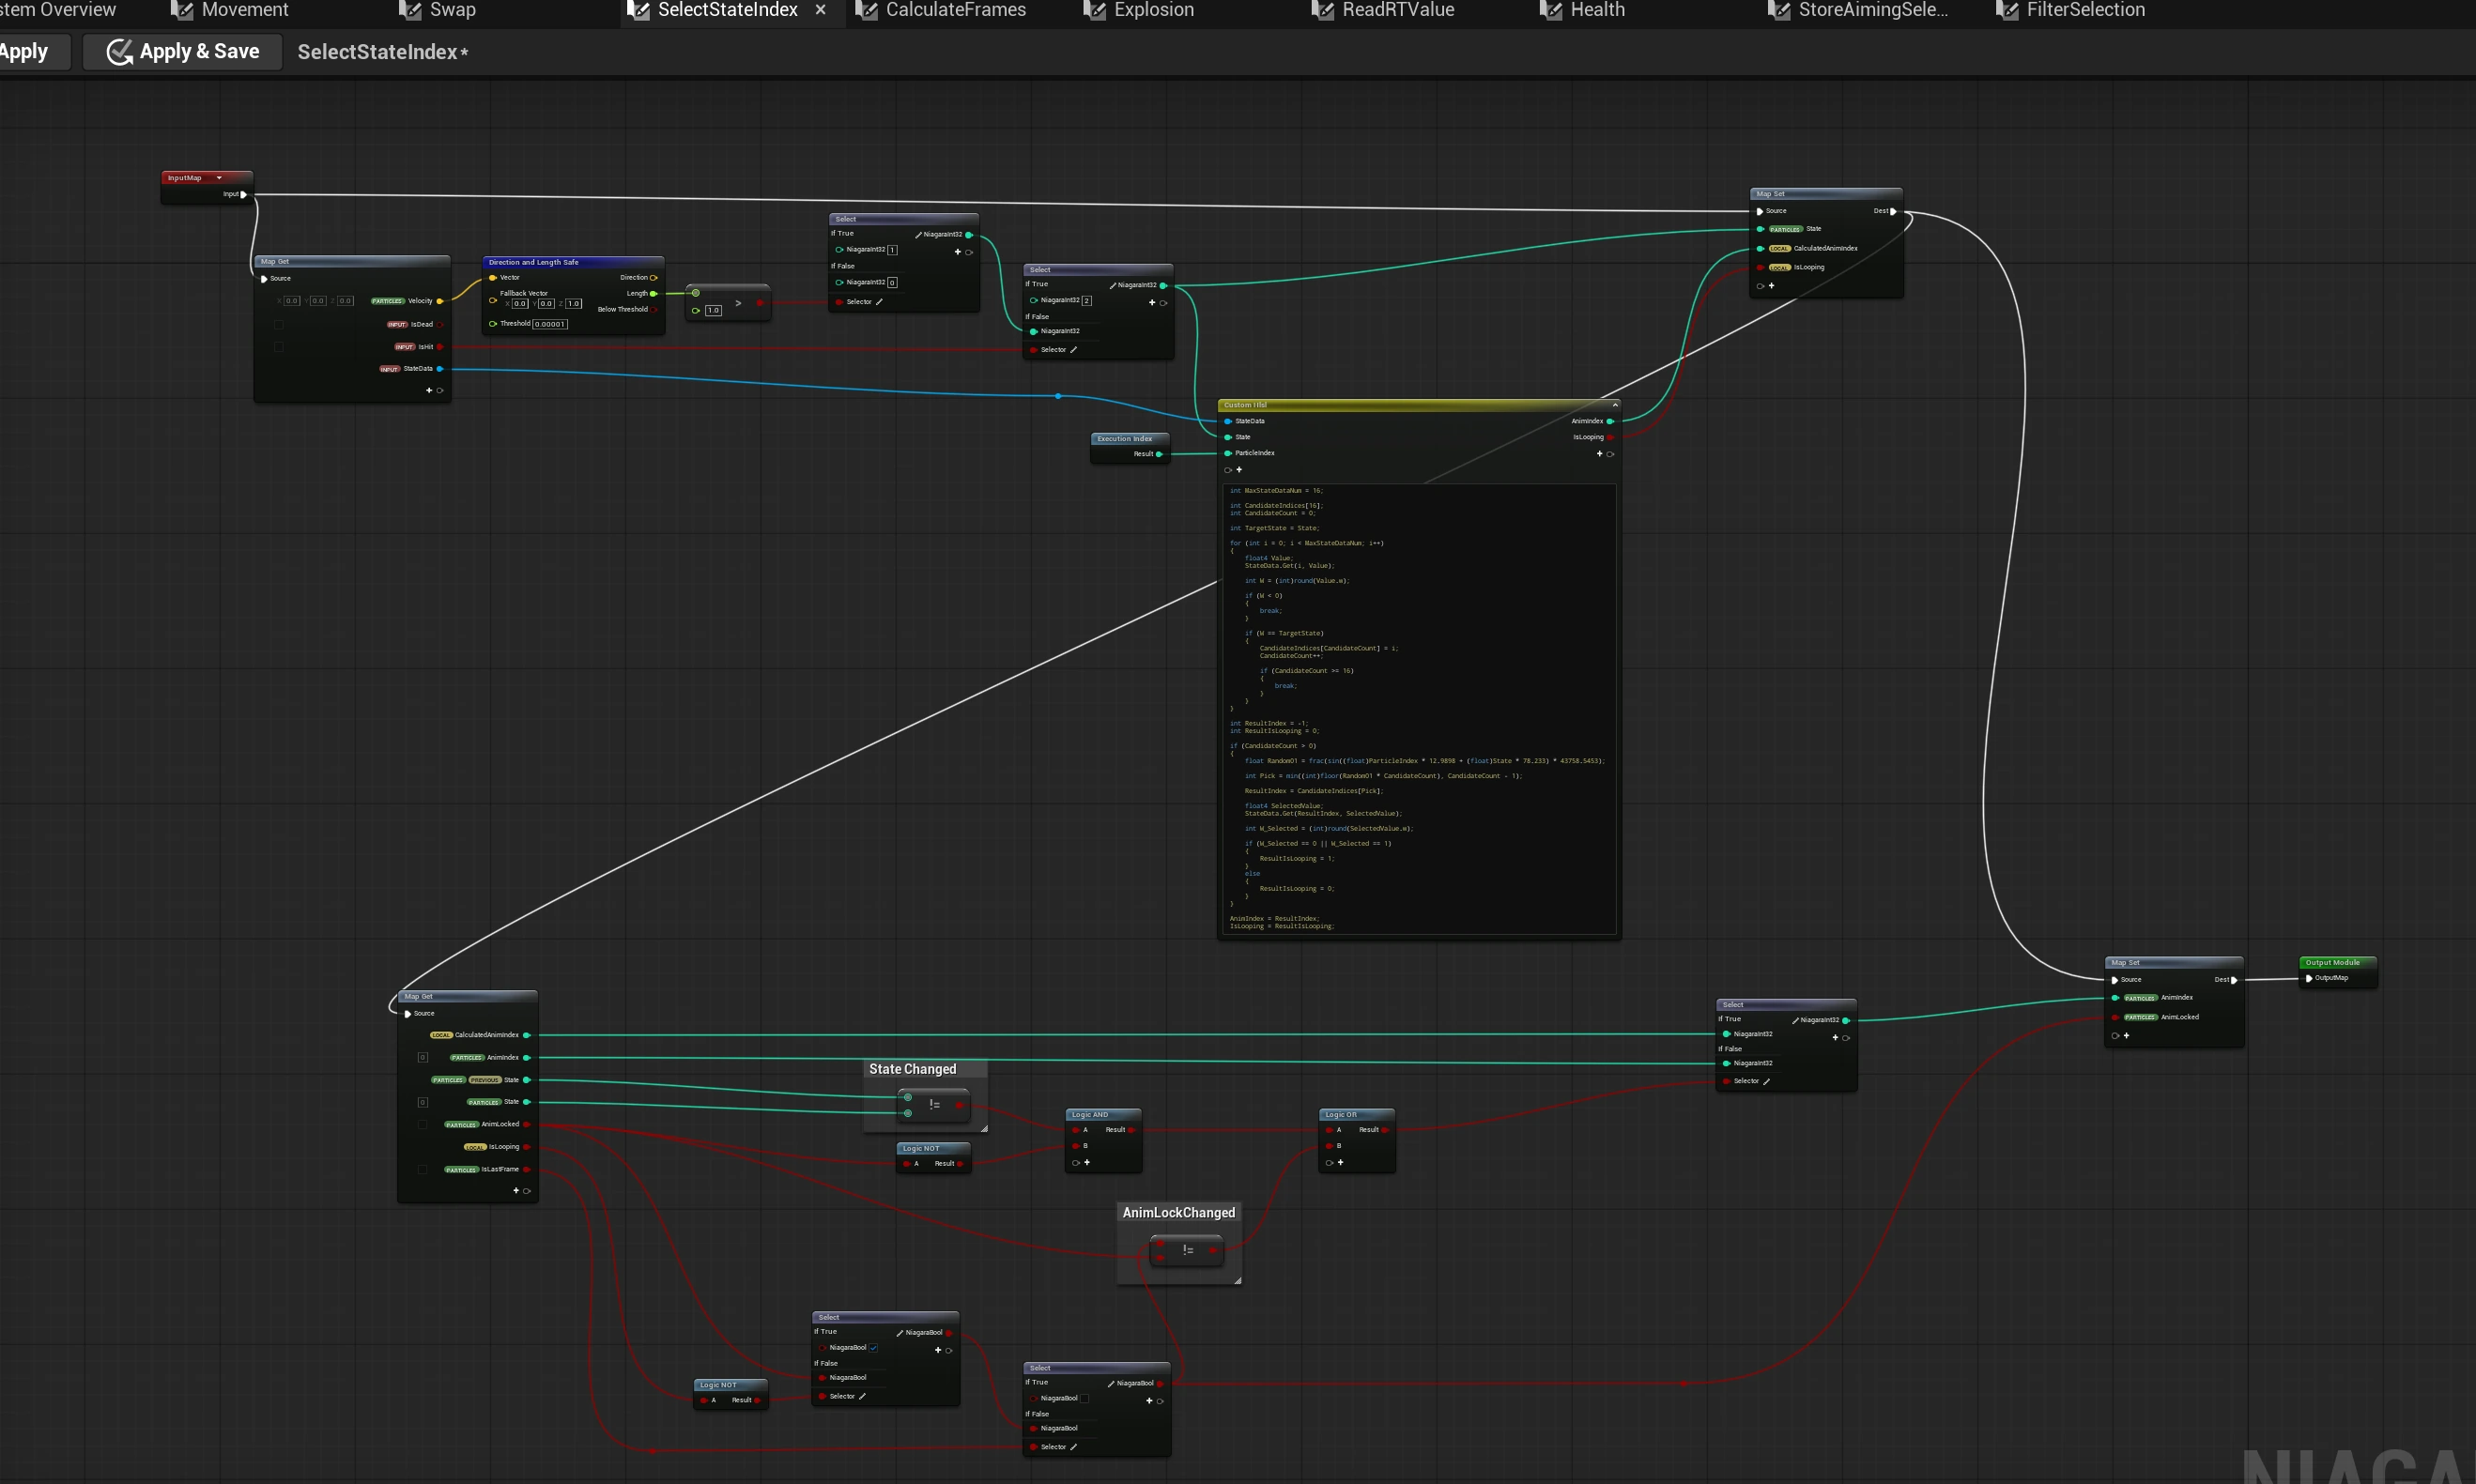
  3. Select index
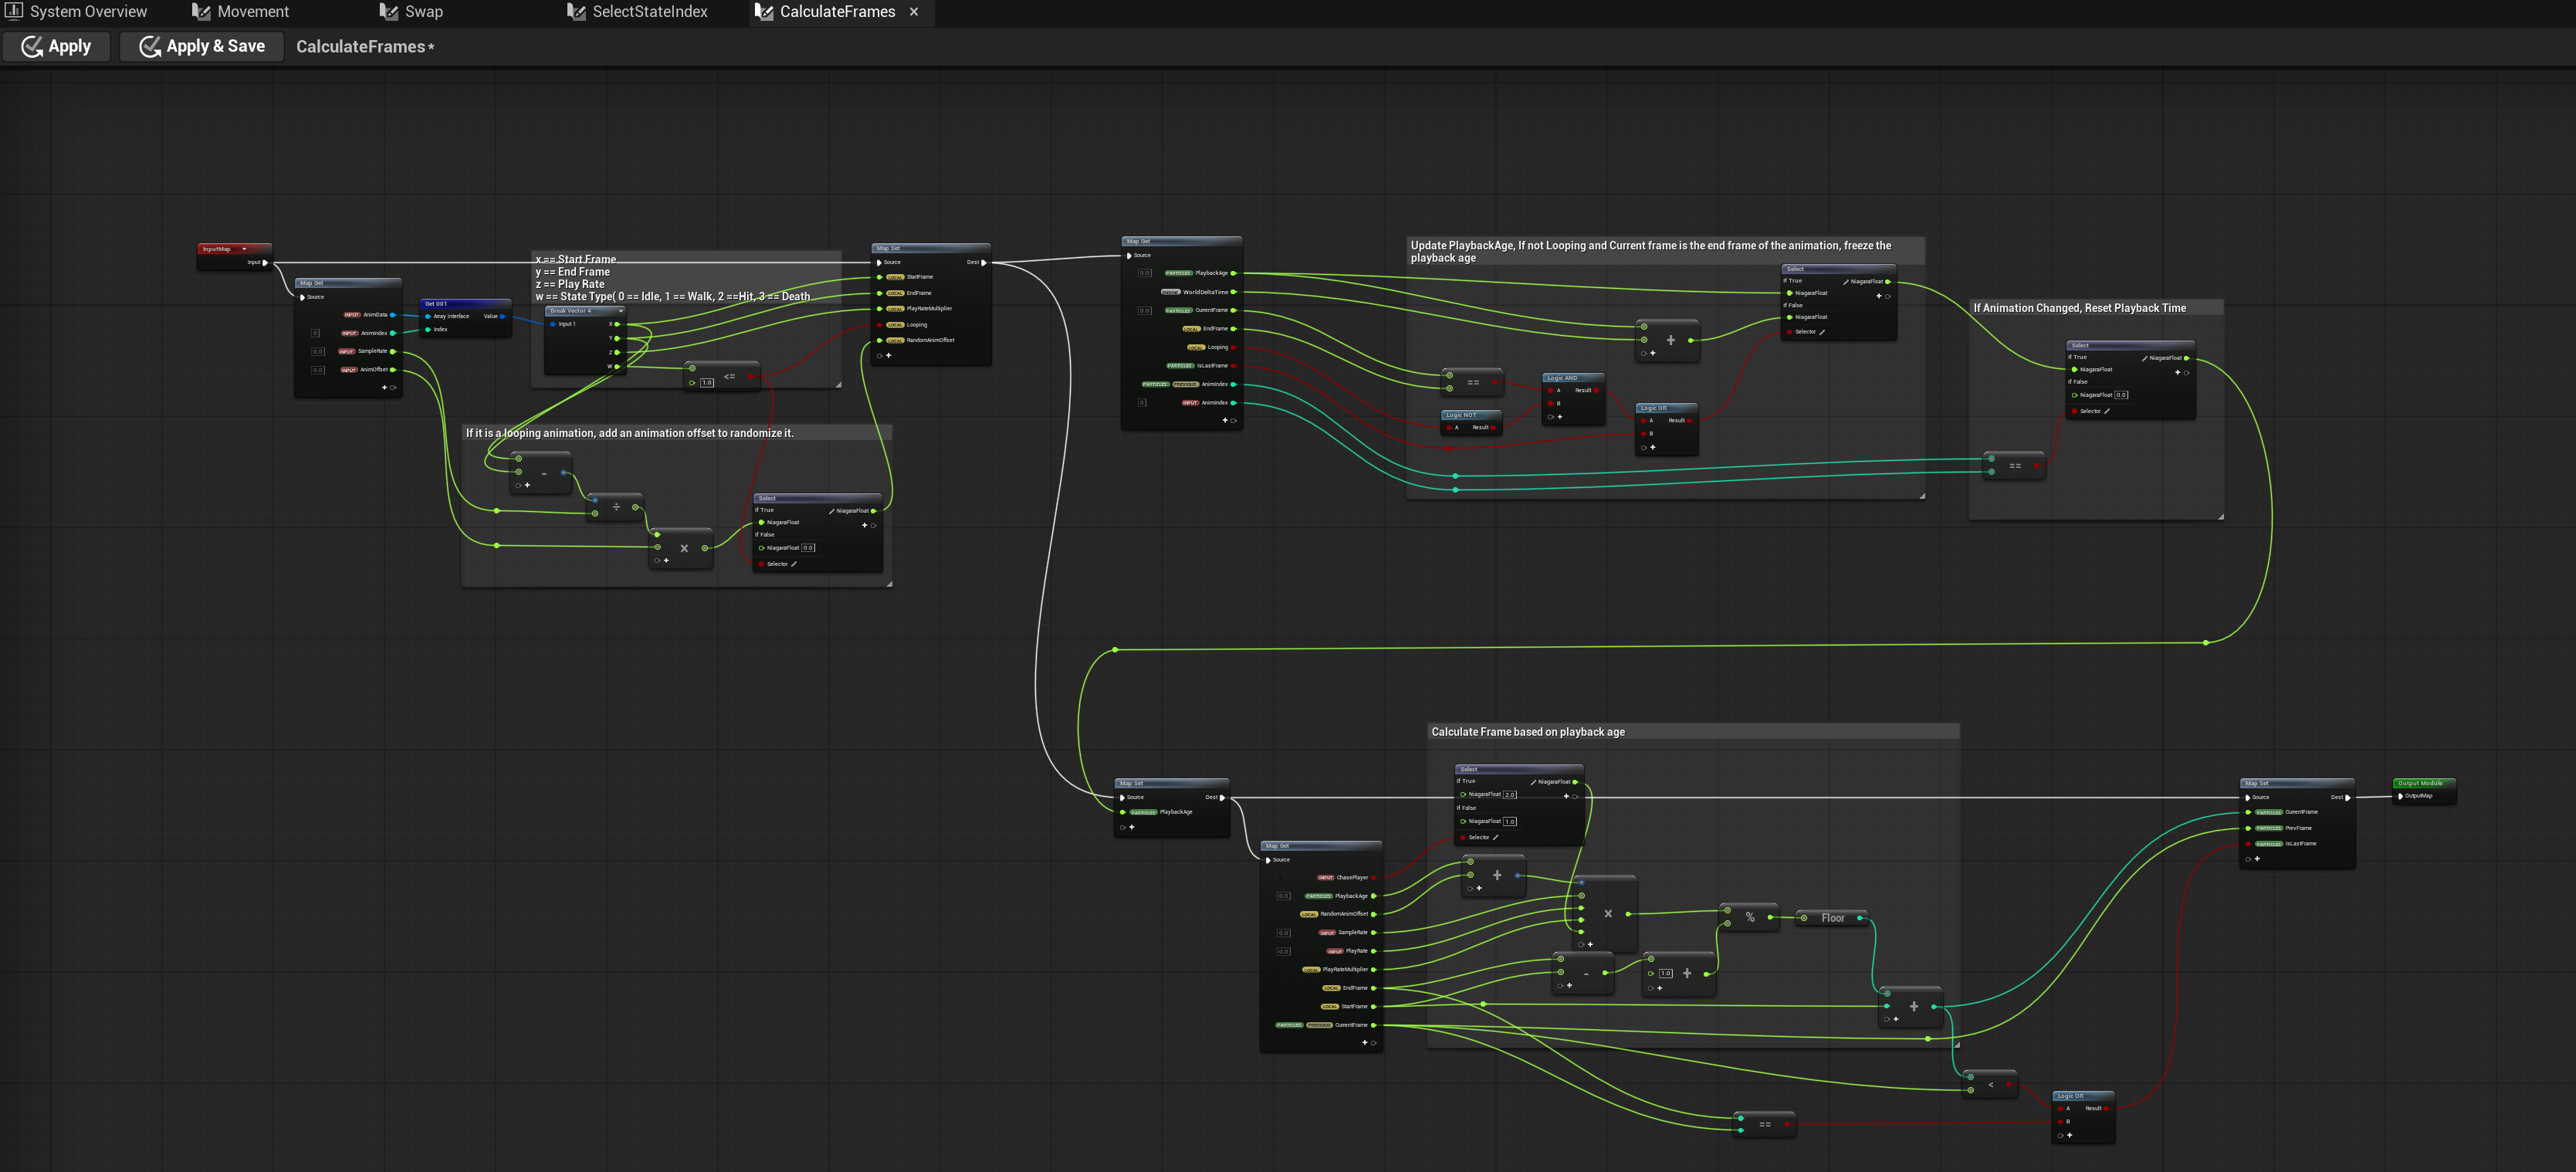
  4. Calculate frame
  5. VAT material
Independent VAT states running across the swarm
Four animation clips packed into a compact Vector4 protocol
State selection resolves movement, hit, and death before writing the animation index
Per-particle playback age, looping, offsets, and final frame output
02

Neighbor Grid3D simulation

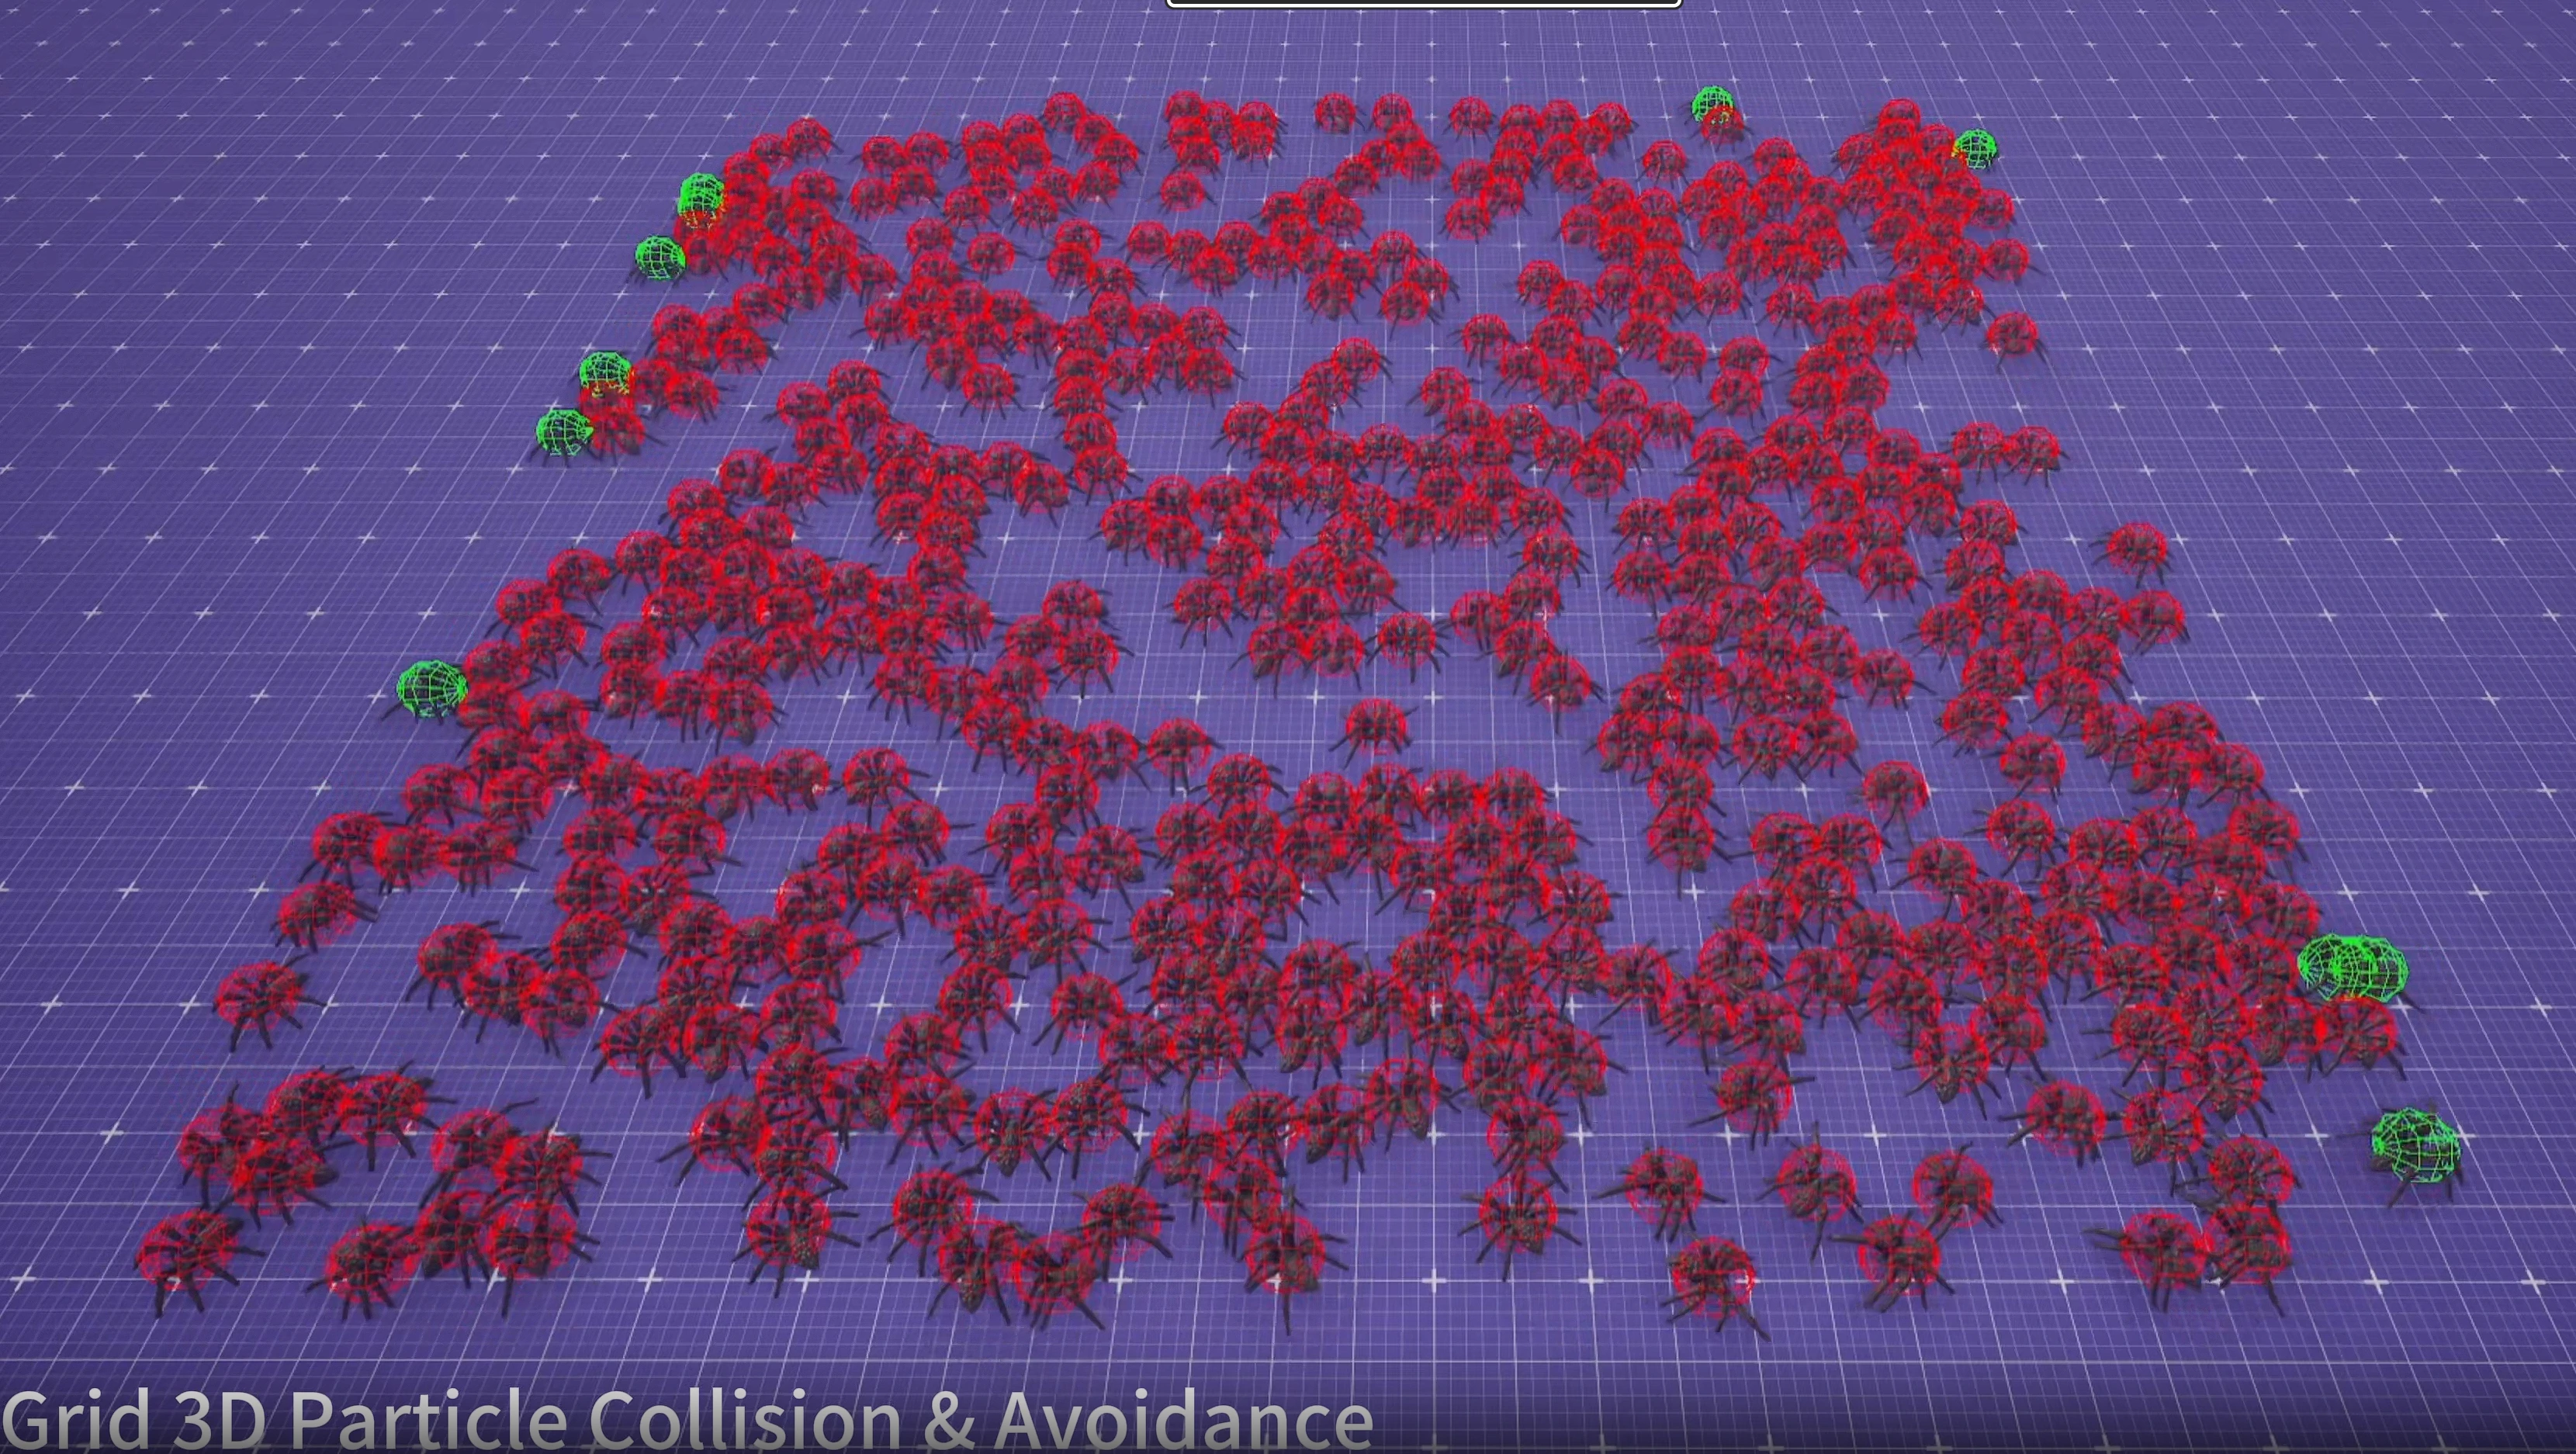
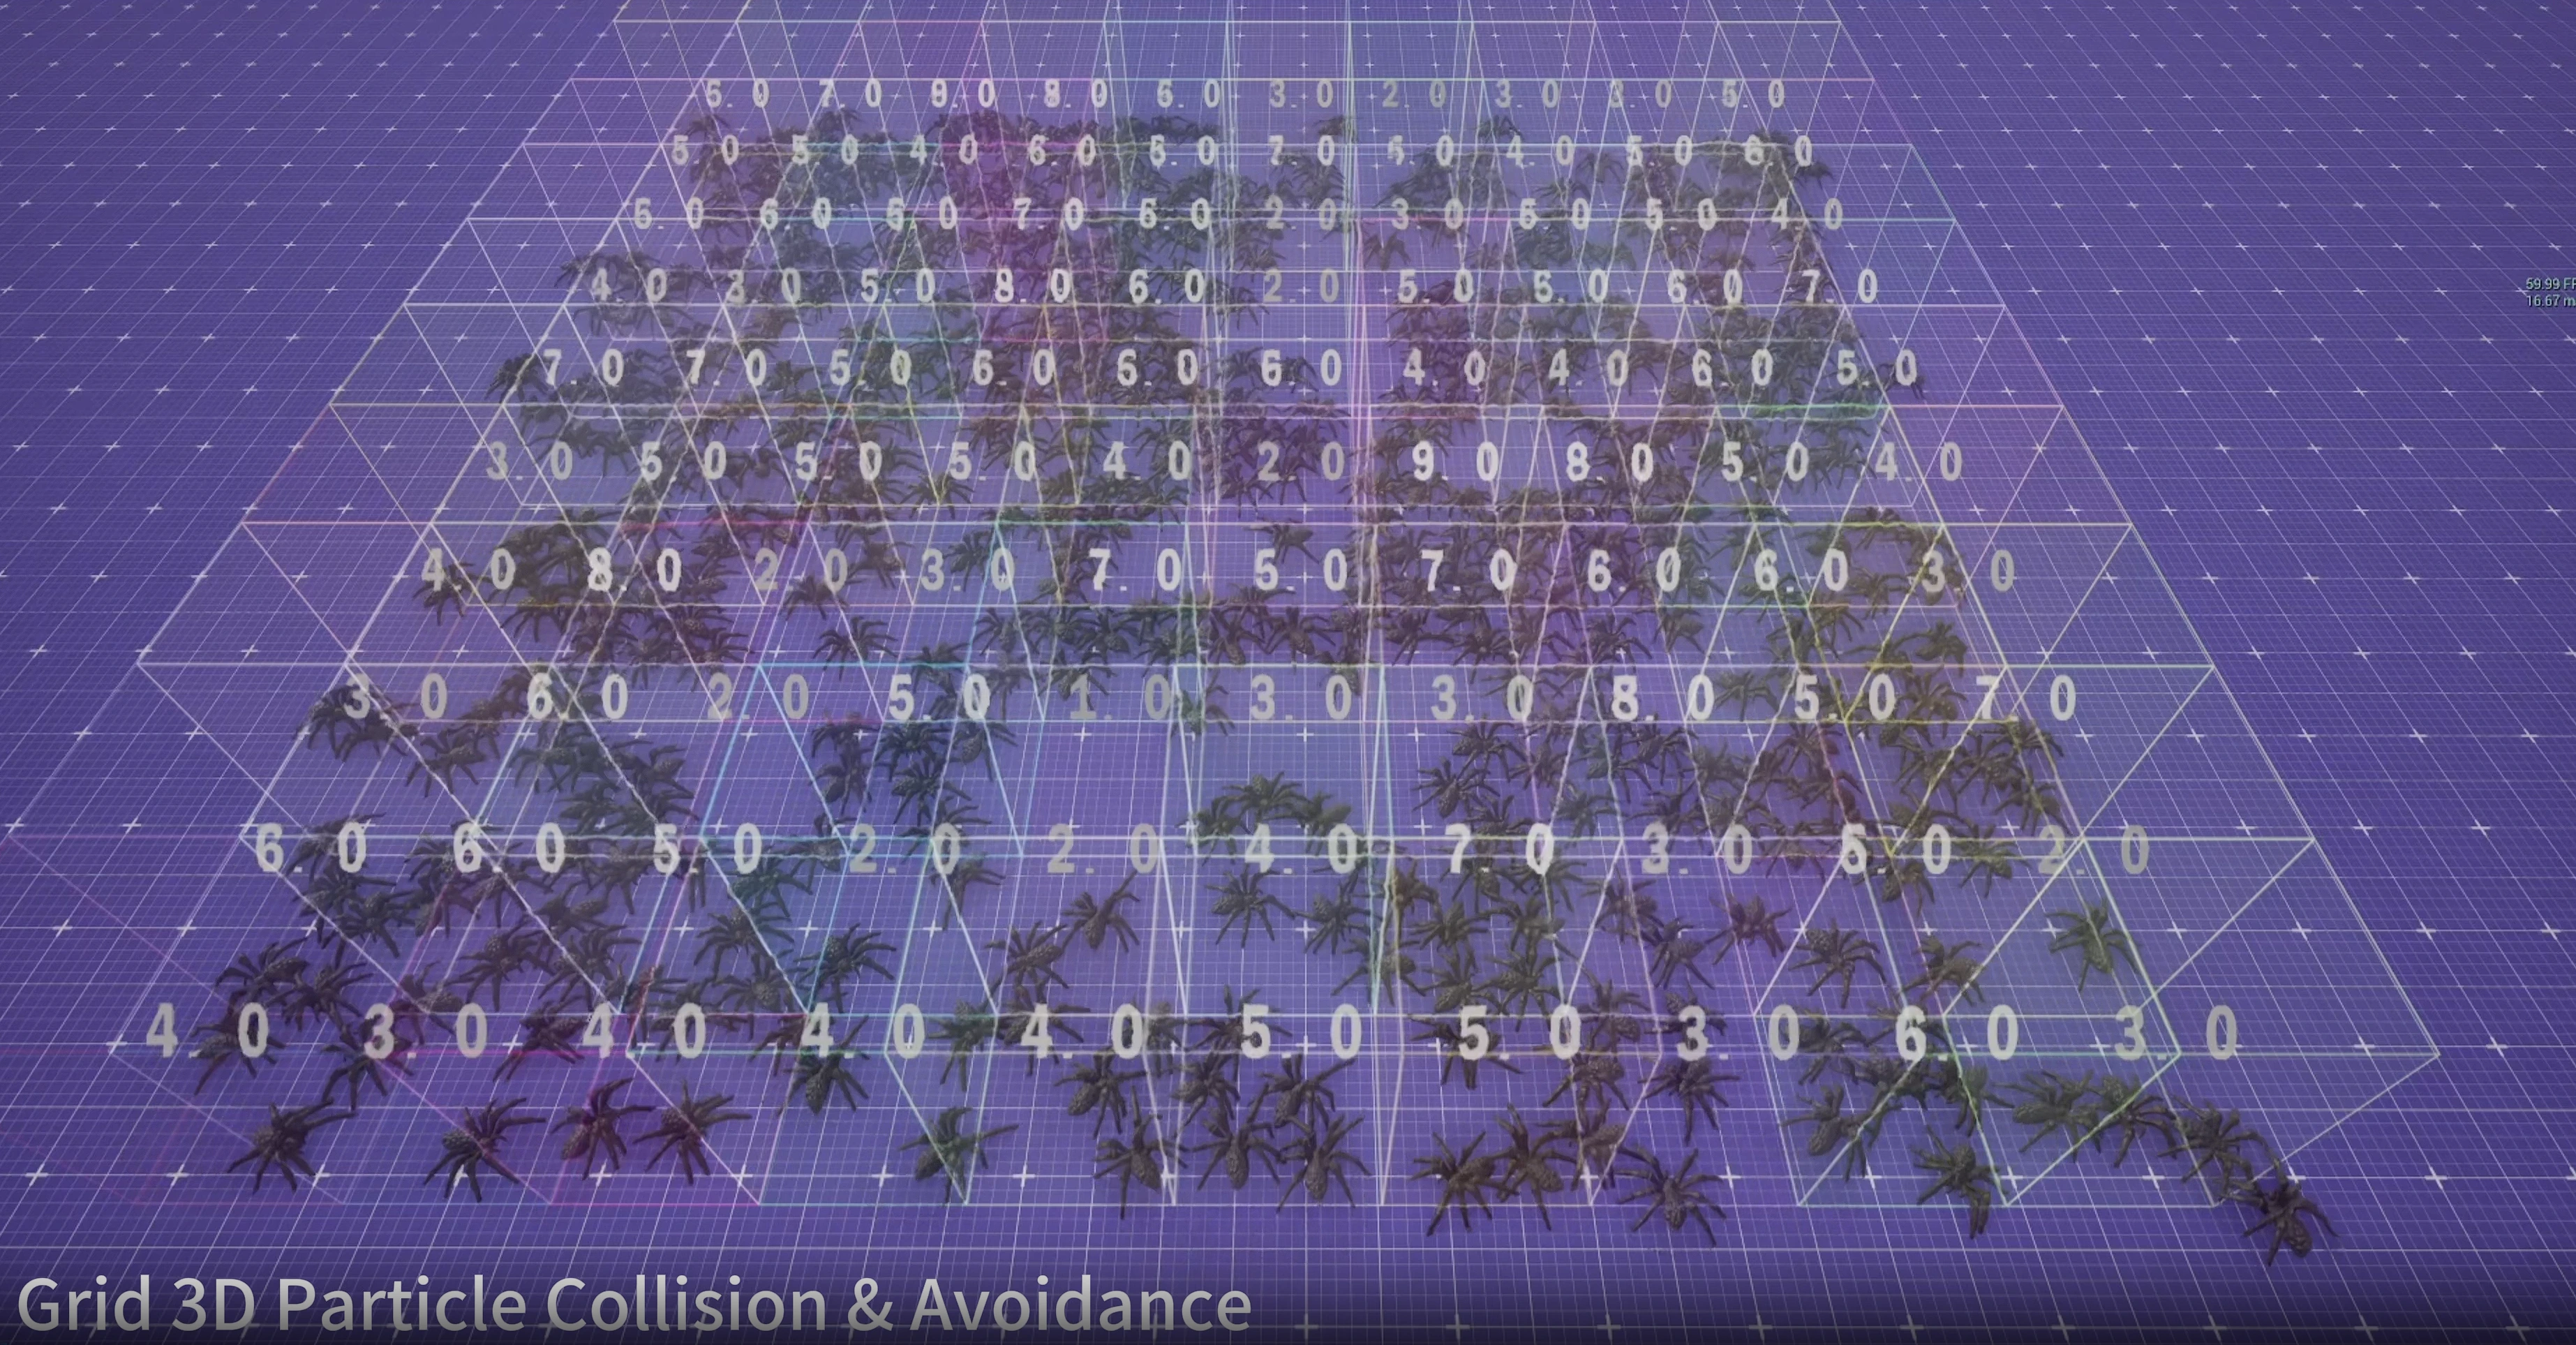
Agents first write their positions into a 3D grid, then query nearby cells for separation and local influence. This keeps the search local instead of comparing every particle with the whole swarm.

  1. Initialize grid
  2. FillGrid
  3. QueryGrid
  4. Neighbor data
  5. Separation
Collision and avoidance visualization, with locally selected agents highlighted in green
Debug Grid showing the number of agents stored in each occupied cell
03

GPU gameplay interaction

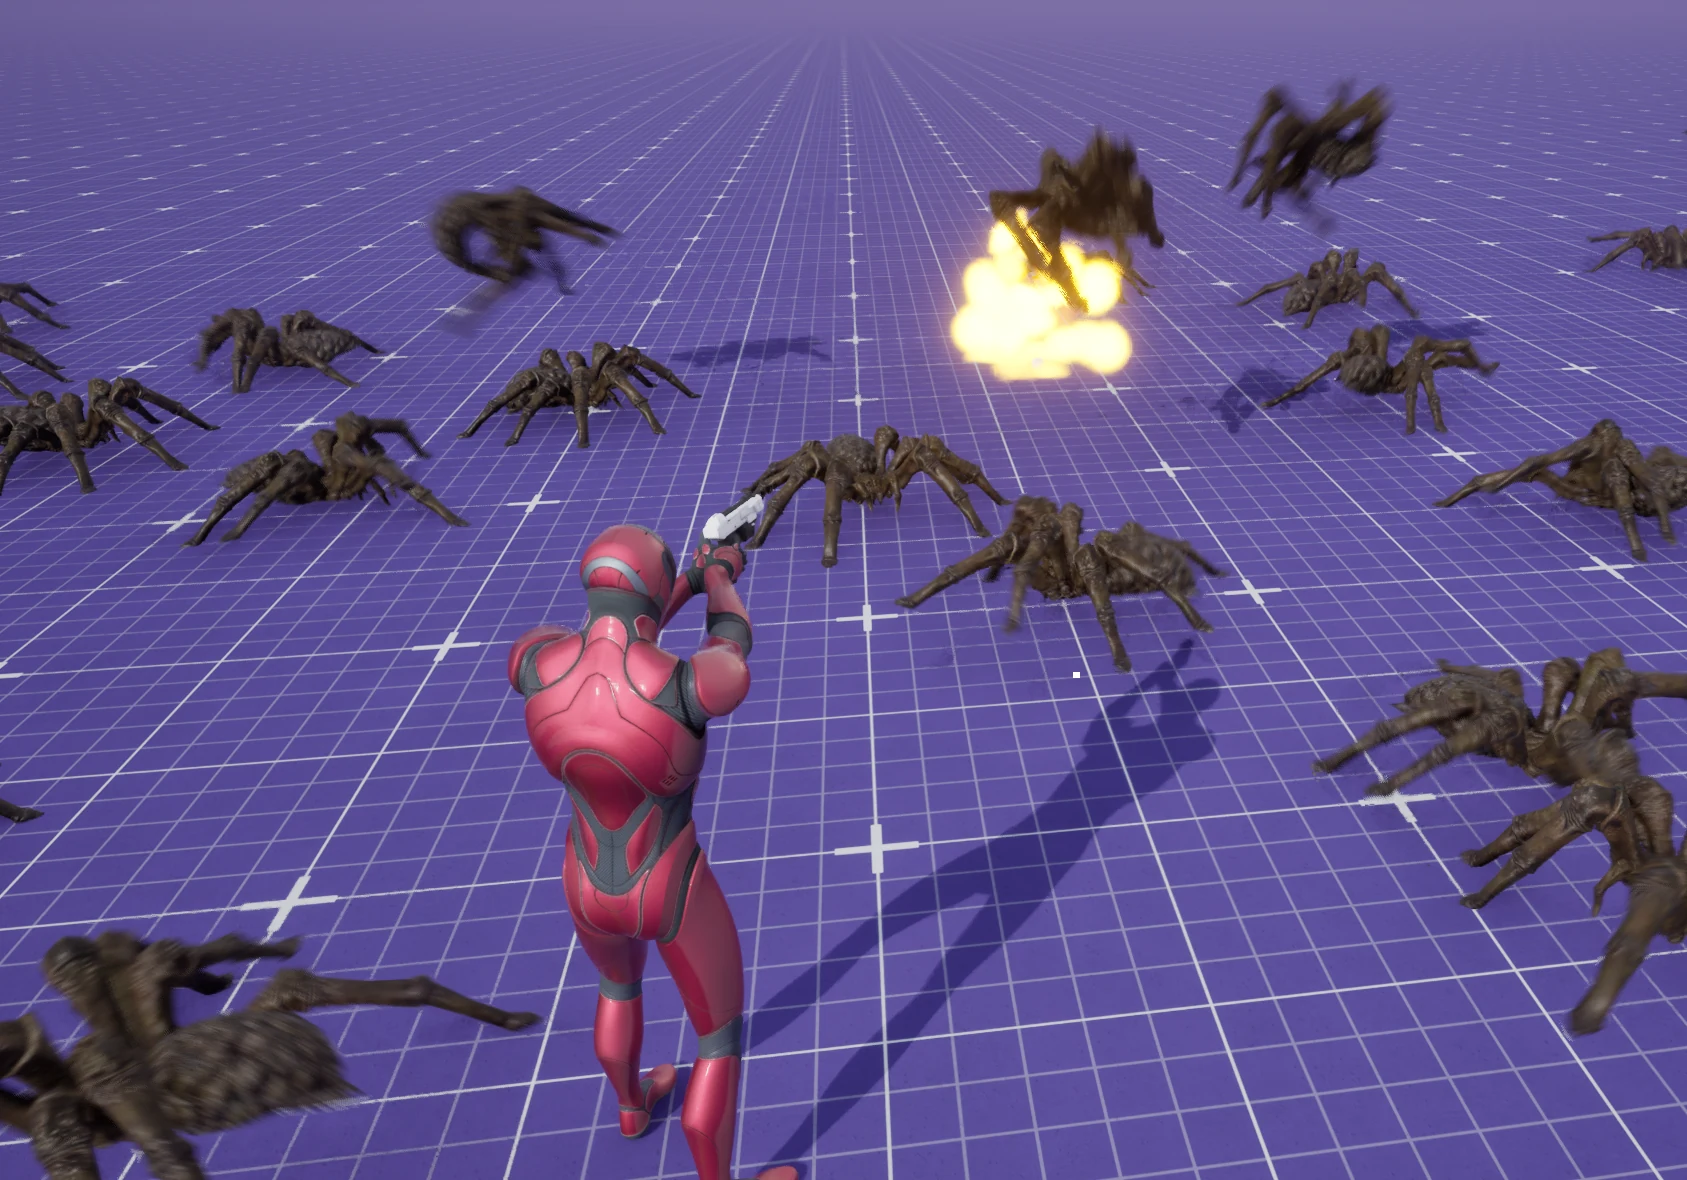
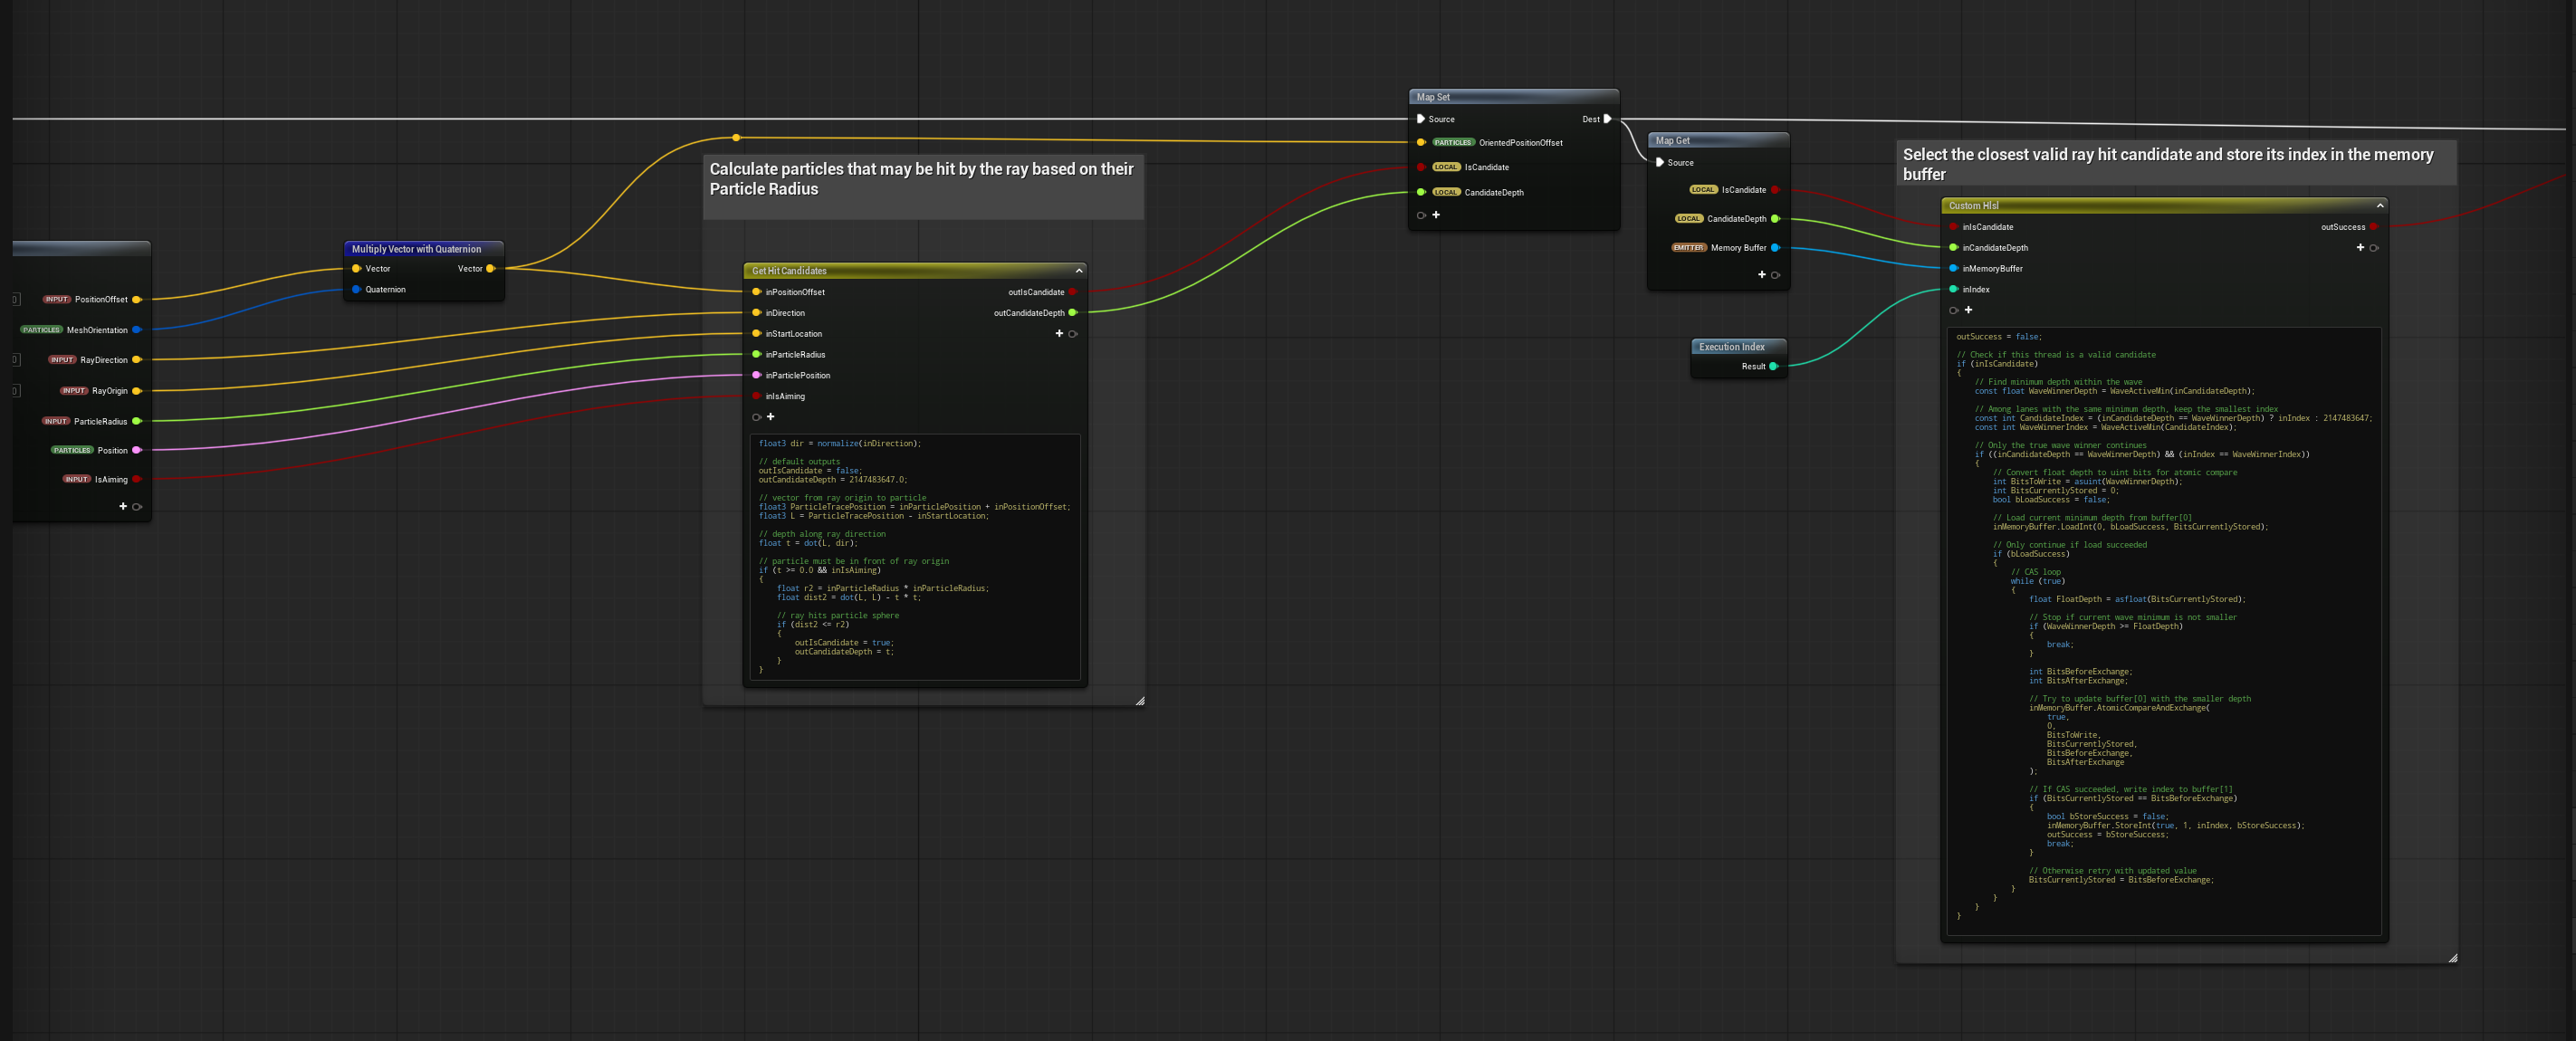
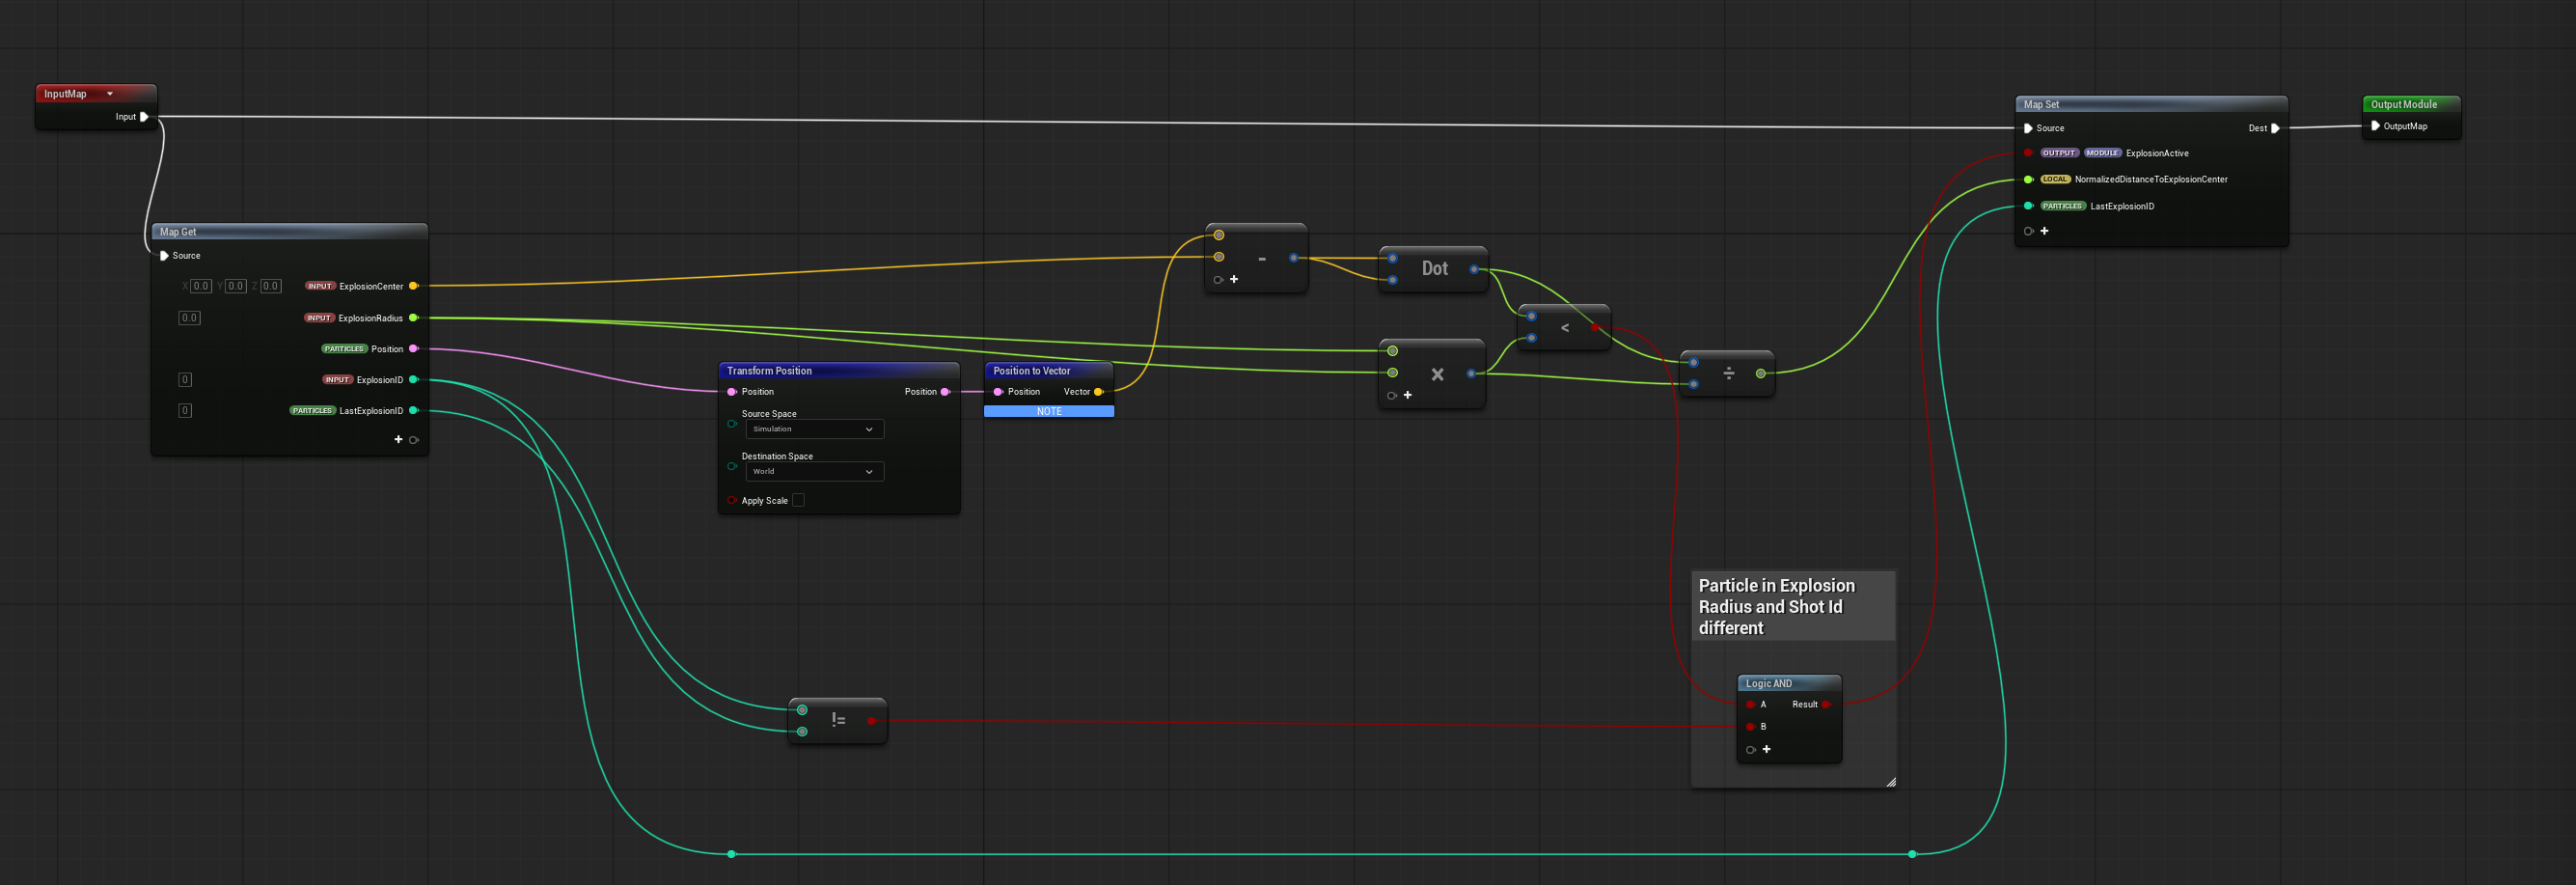
The same health and state pipeline accepts three kinds of input: a single ray hit, a radial explosion, or continuous damage painted into a Render Target.

  1. Gameplay input
  2. Find affected agent
  3. Apply damage
  4. Update state
Radial explosion damage and GPU-to-CPU reactions
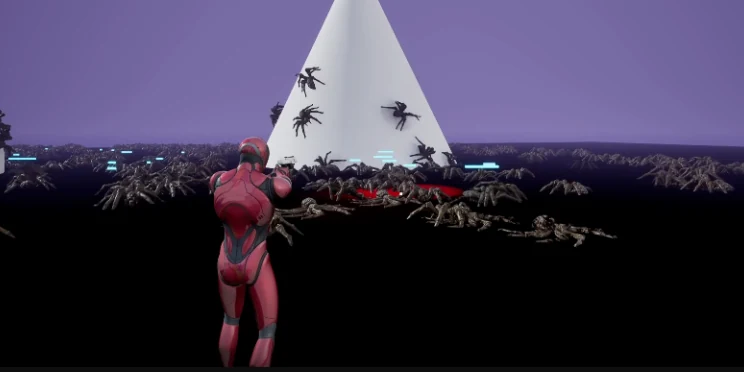
Render Target-driven damage over time
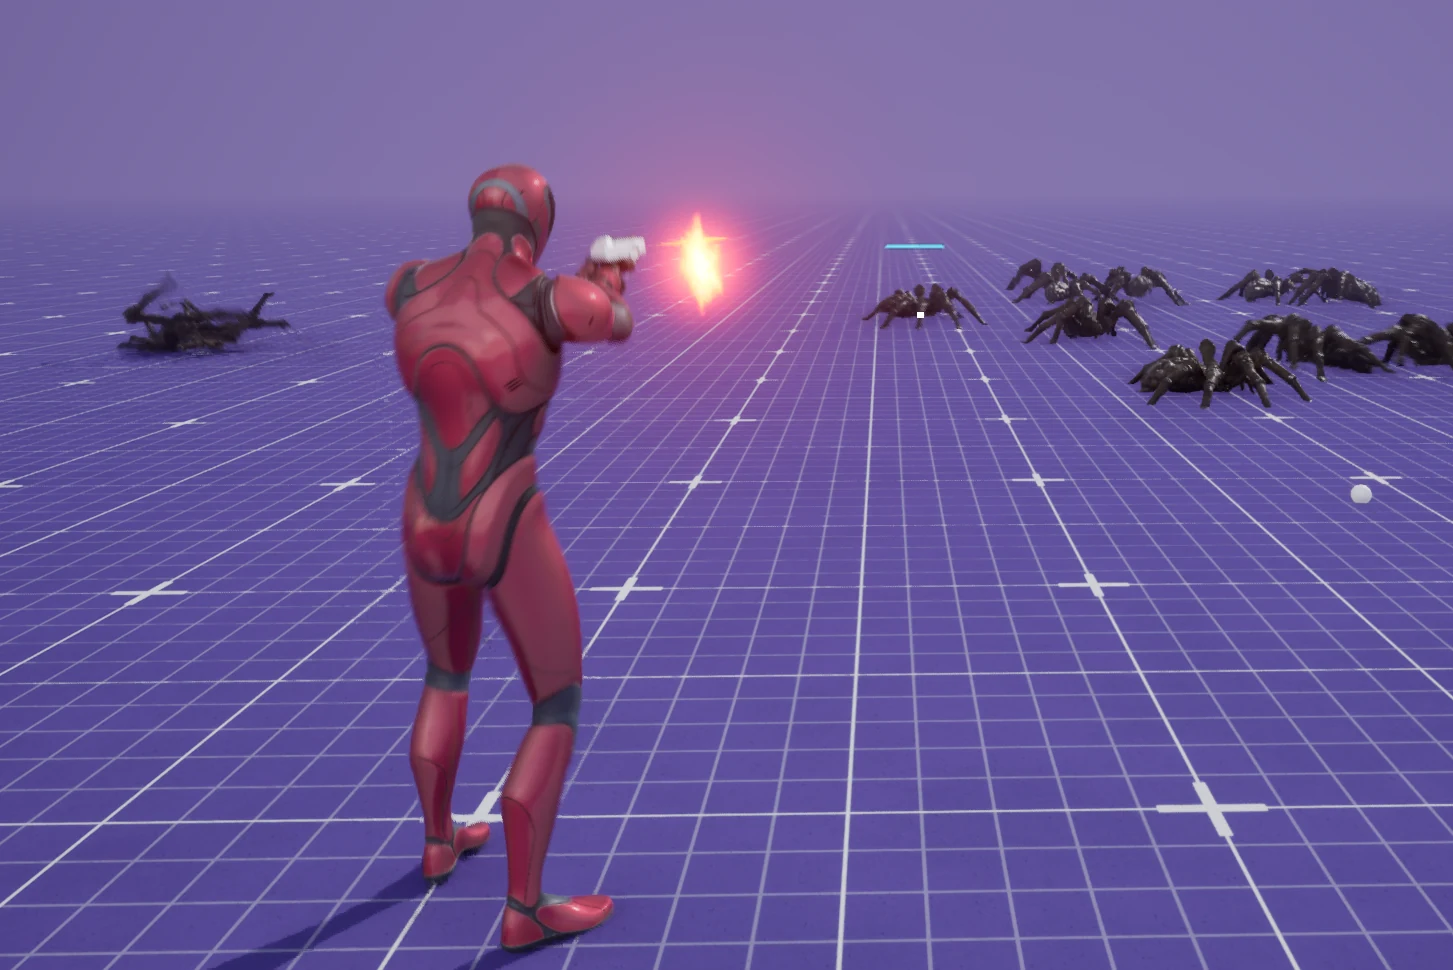
Line Trace targeting and single-agent damage
Ray candidates are tested in parallel; a shared buffer keeps the closest valid hit
Explosion radius and event ID prevent repeated processing across frames
World position is converted to Render Target UVs before sampling continuous damage
04

GPU-to-CPU agent swap

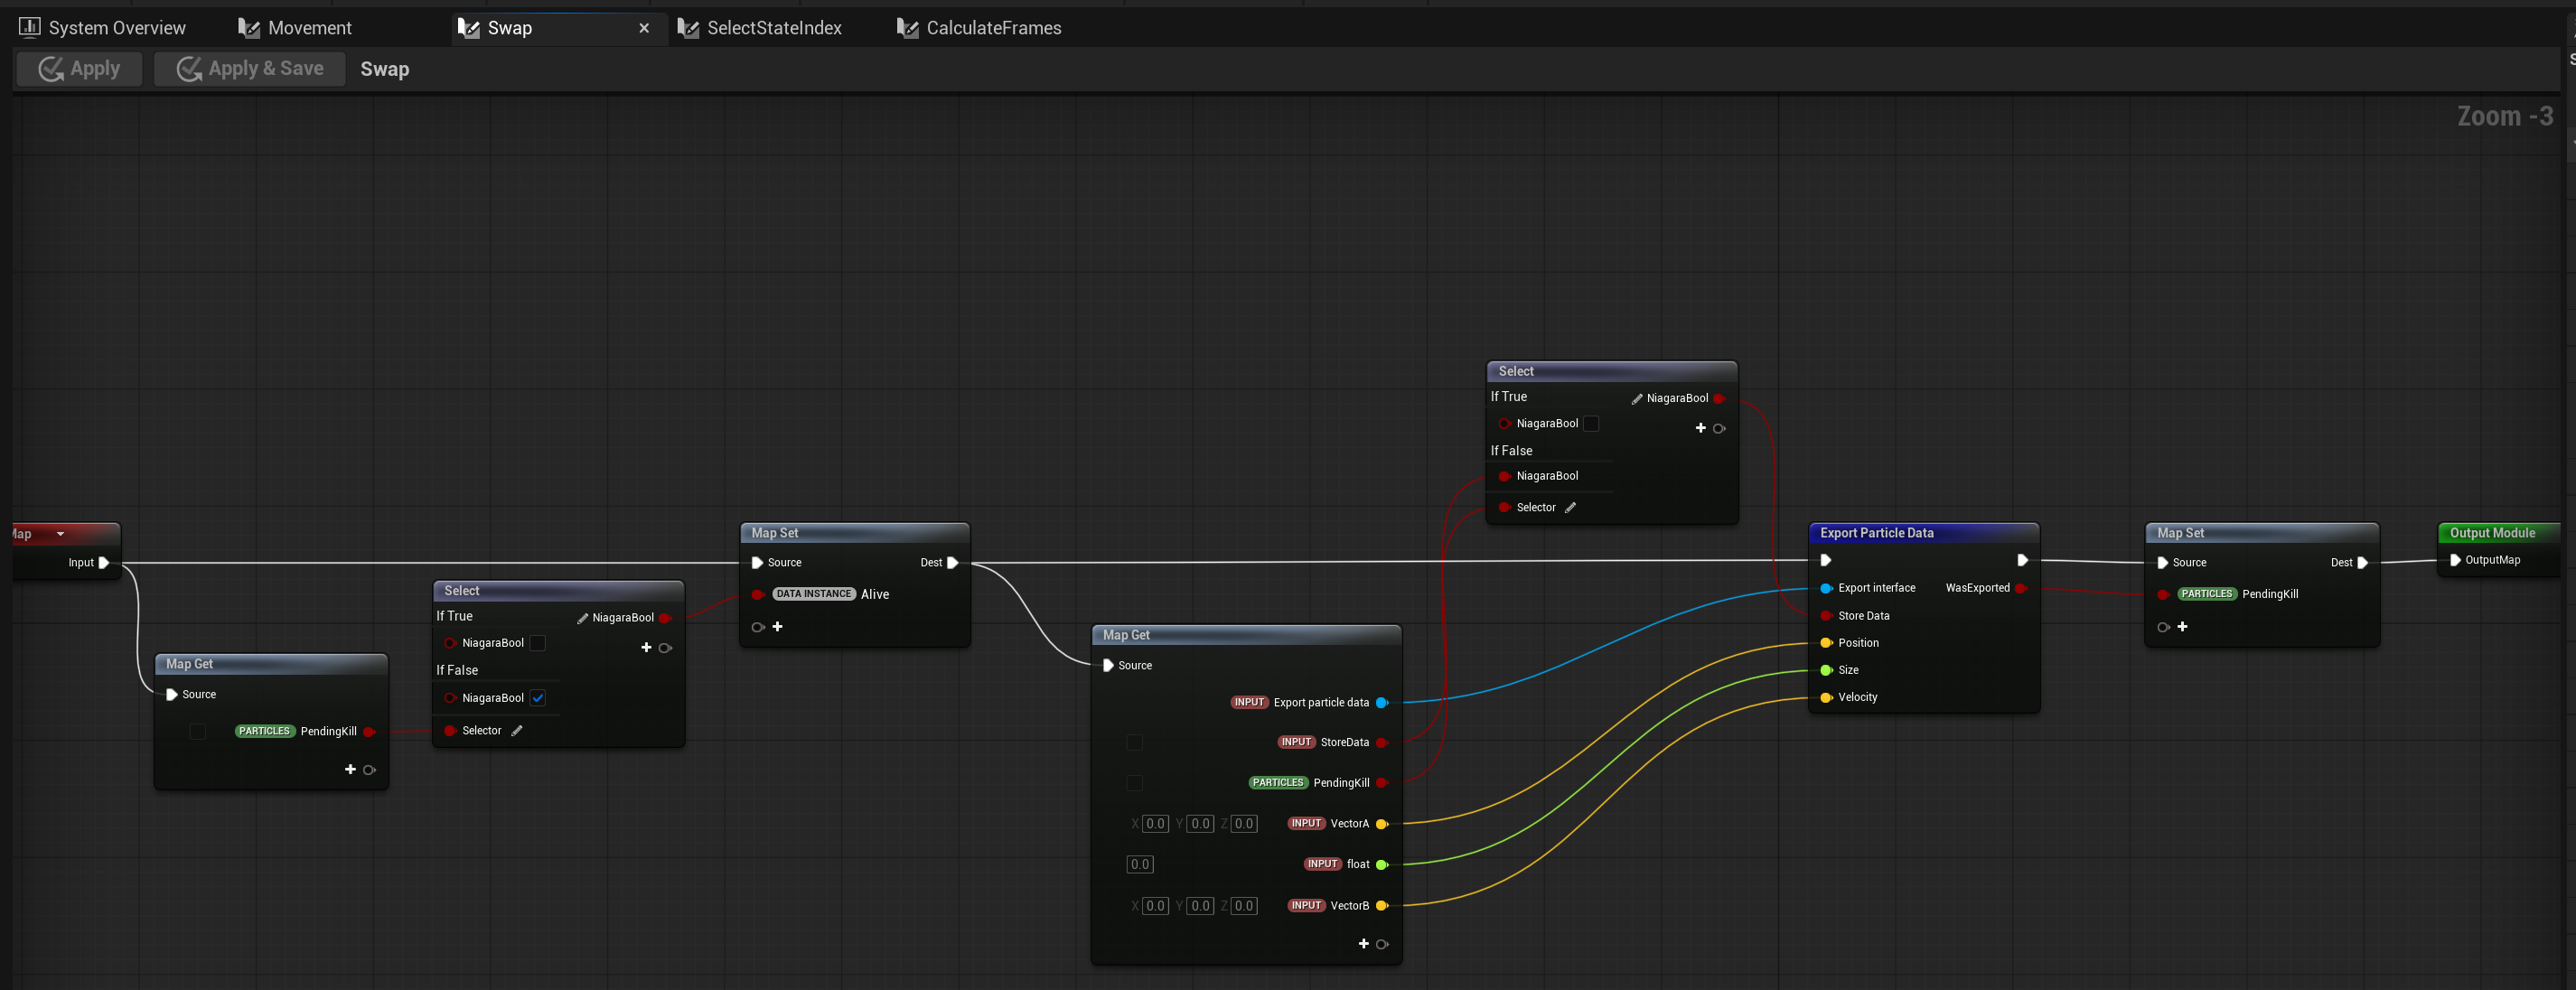
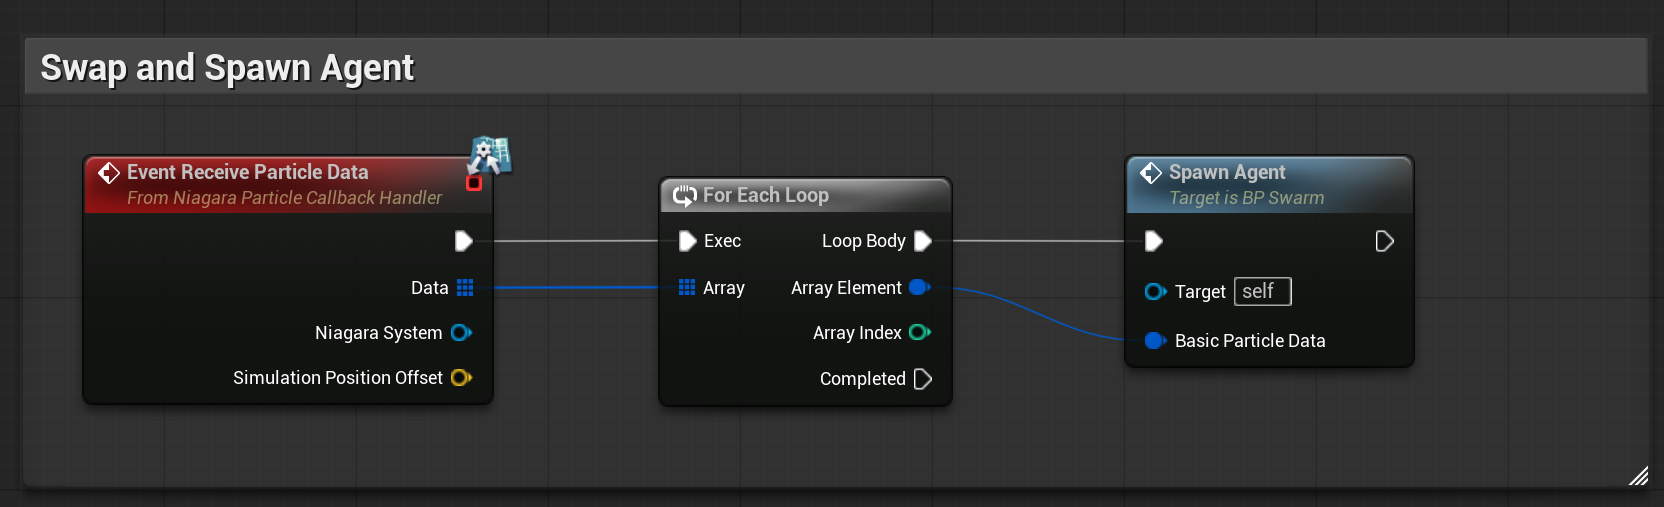
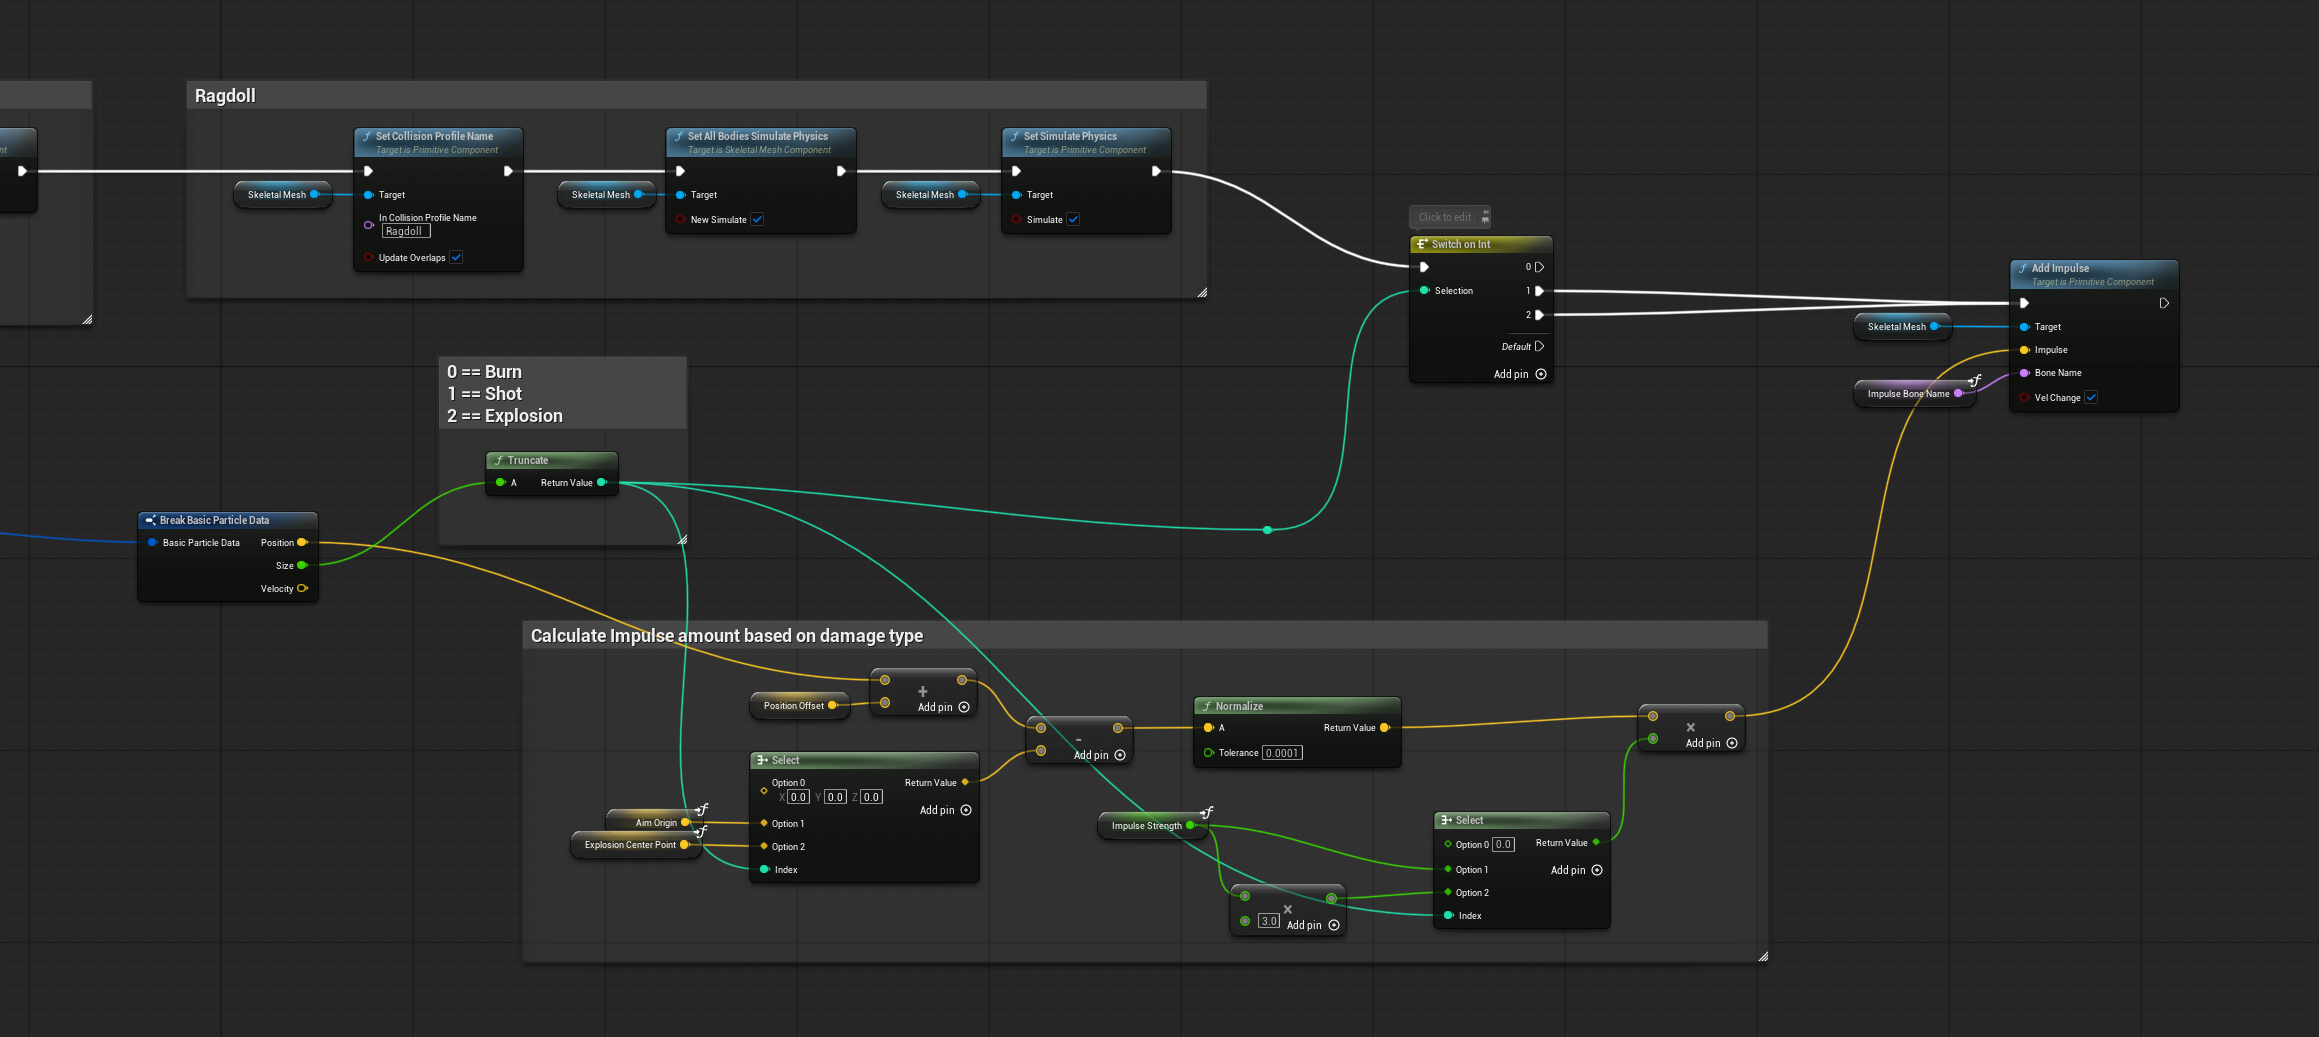
GPU particles handle the crowd. When an agent needs a detailed physical death, Niagara exports only the required data, Blueprint spawns a matching CPU agent, and the response continues as a ragdoll with a direction-aware impulse.

  1. Death event
  2. Export particle data
  3. Callback
  4. Spawn BP agent
  5. Ragdoll + impulse
GPU agent handed off to a Blueprint ragdoll
Niagara exports position, damage type, and impact context before removing the GPU particle
The callback receives exported particles and creates the CPU agents
Damage type selects the physical response and impulse direction

Performance / Profiling study

Performance analysis

I compared mesh and material changes at 10K particles, then increased the count and checked the simulation stages.

Unreal Editor Β· 2560 Γ— 1440 Β· 100% screen percentage
01

10,000 particles: rendering cost

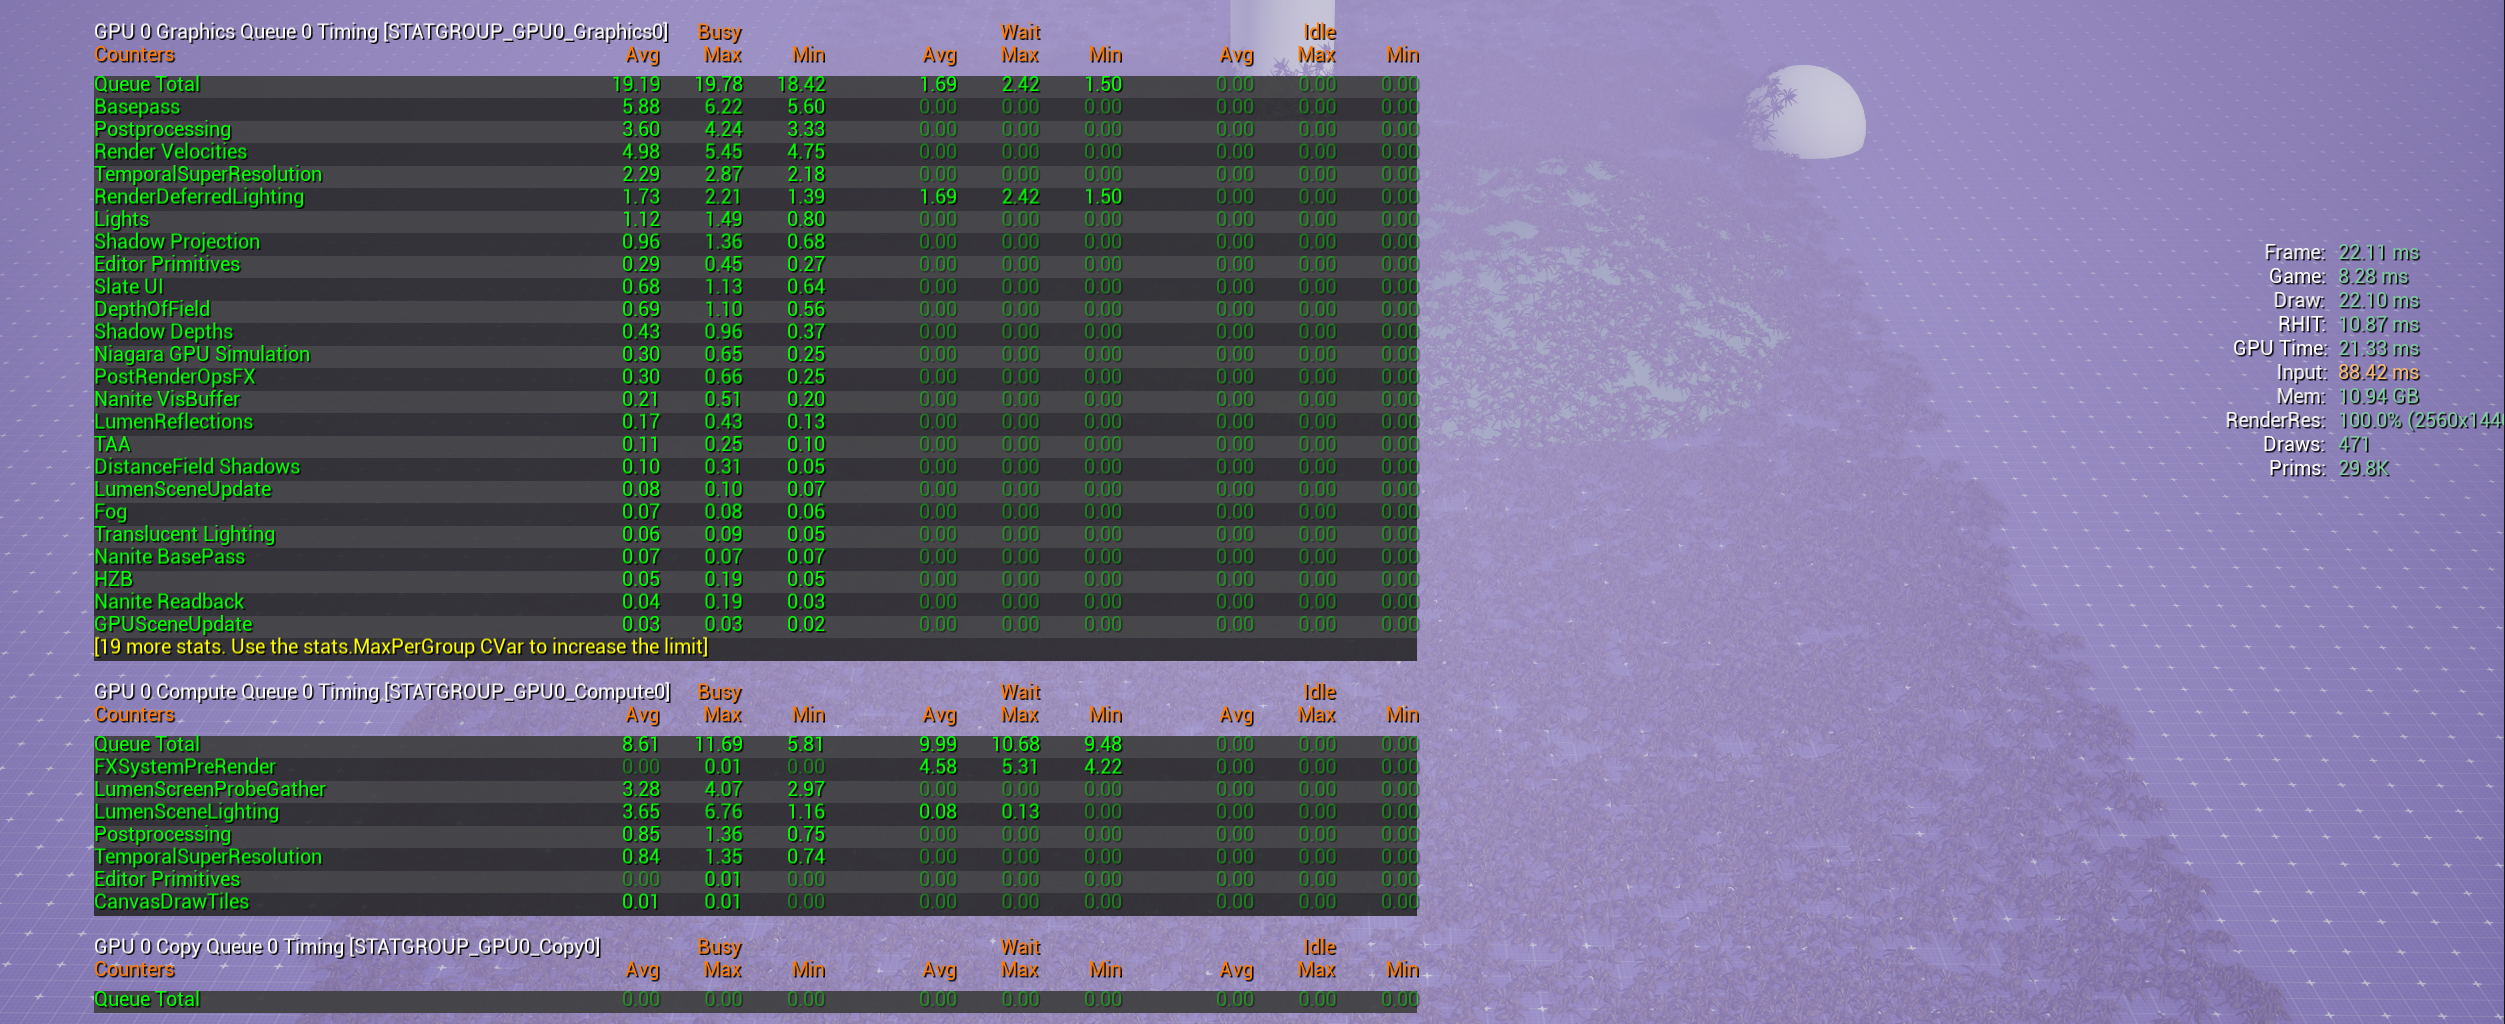
BasePass takes 5.88 ms and Velocity 4.98 ms, compared with 0.30 ms for Niagara simulation. Replacing the mesh with a Cube drops GPU time by about 10 ms; disabling VAT alone makes a much smaller difference. These tests point to rendering as the first area to work on, but do not separate geometry, material and pixel coverage costs.

Rendering comparisons10,000 agents Β· milliseconds Β· lower is better
ConfigurationGPU timeBasePassVelocity
LOD0 + VATOriginal mesh Β· 7,160 triangles21.13–21.335.884.98
VAT offSmall change with this material switch20.49–20.675.374.60
CubeDiagnostic substitution Β· different geometry and appearance11.28–11.340.660.17
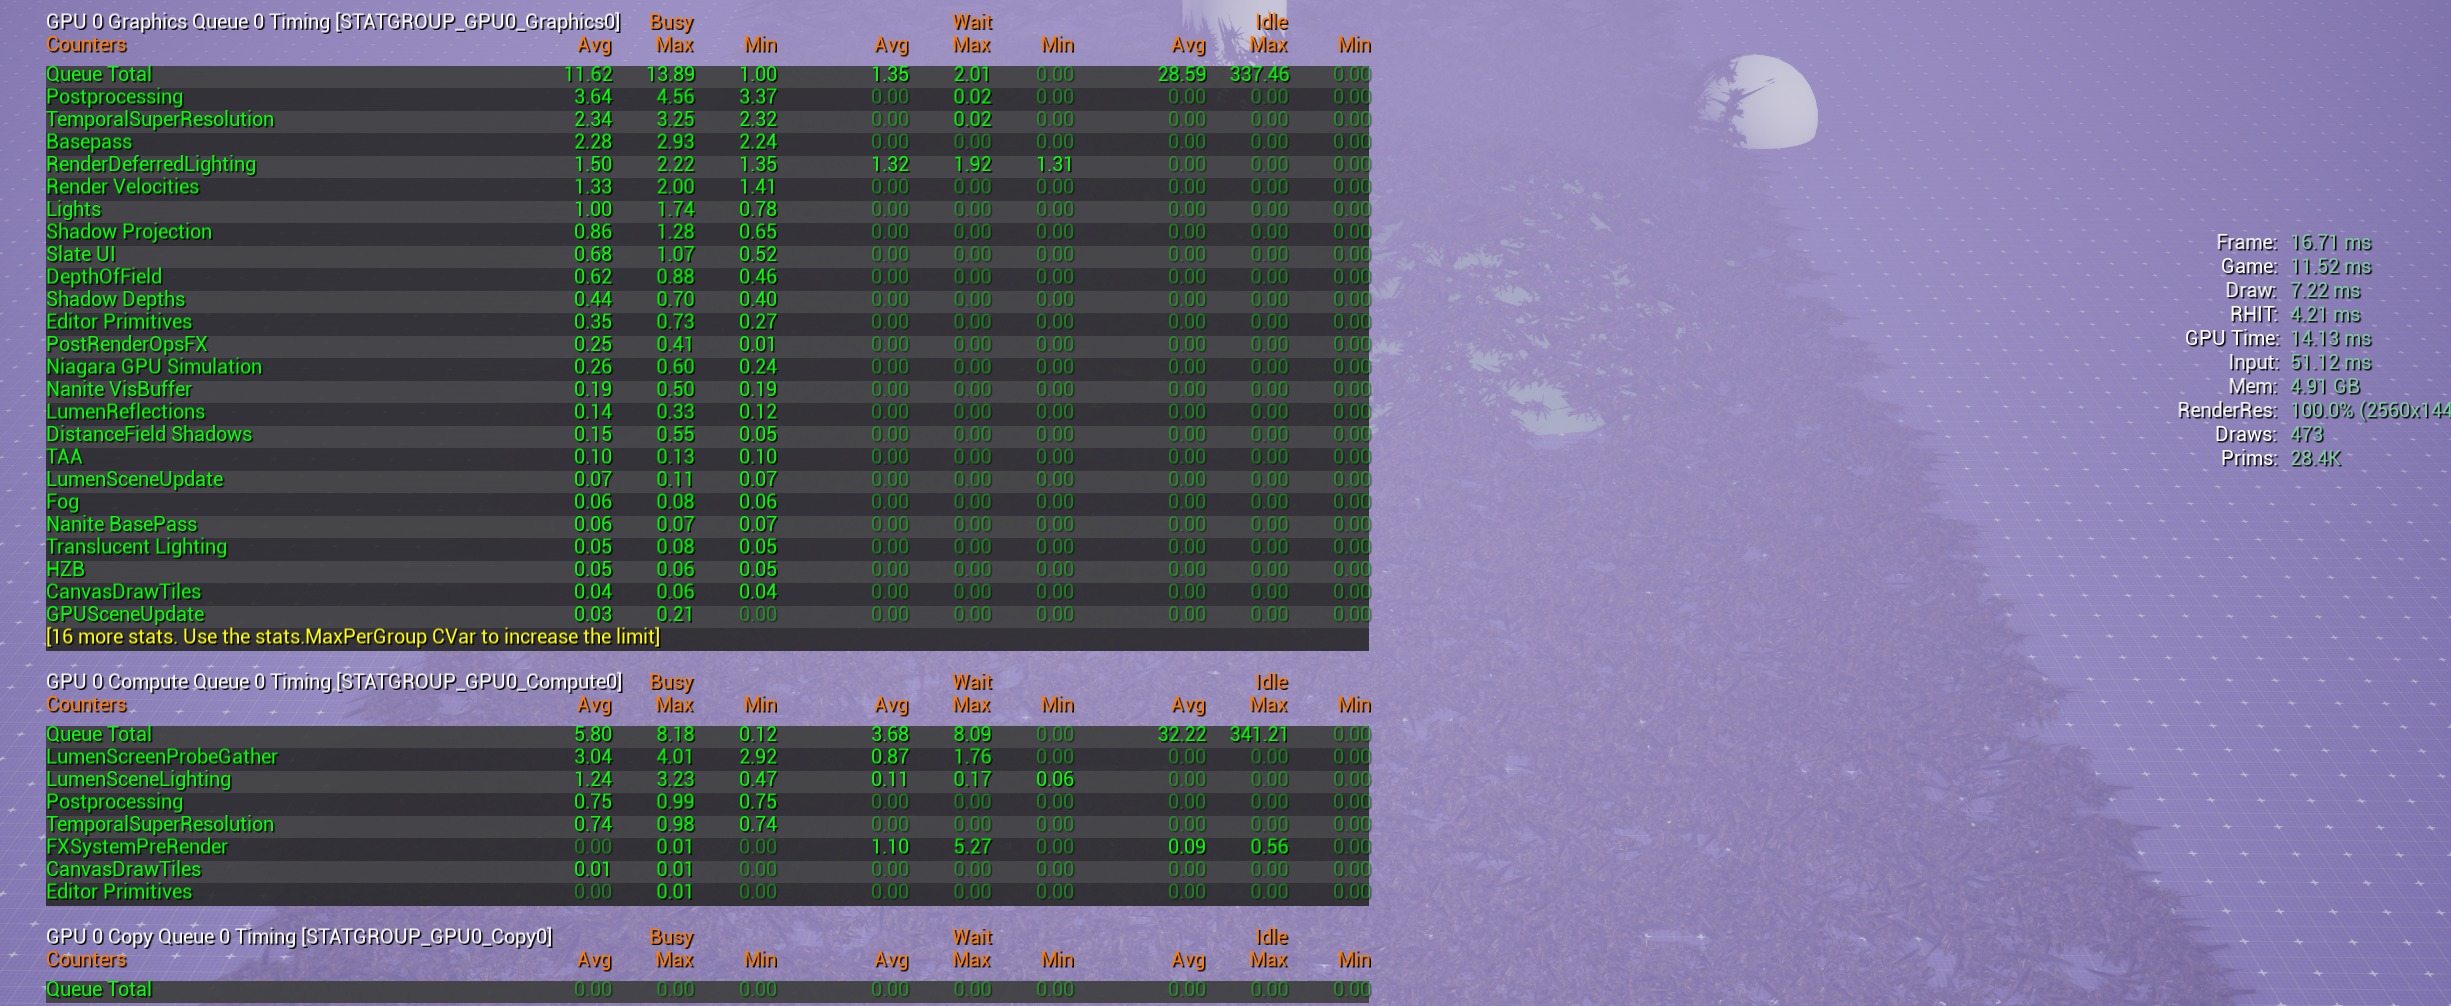
LOD21,792 triangles Β· VAT deformation present14.13–14.342.281.33
Nanite SupportExploratory Β· actual particle rendering path unverified18.79–18.924.723.35

GPU ranges show paired screenshot readings; pass timings are the displayed Busy Avg. These are editor comparisons, not repeated-run benchmarks. Pass timings are not additive across GPU queues.

LOD0 Β· BasePass 5.88 ms / Velocity 4.98 ms
LOD2 Β· BasePass 2.28 ms / Velocity 1.33 ms

LOD potential, with a production constraint

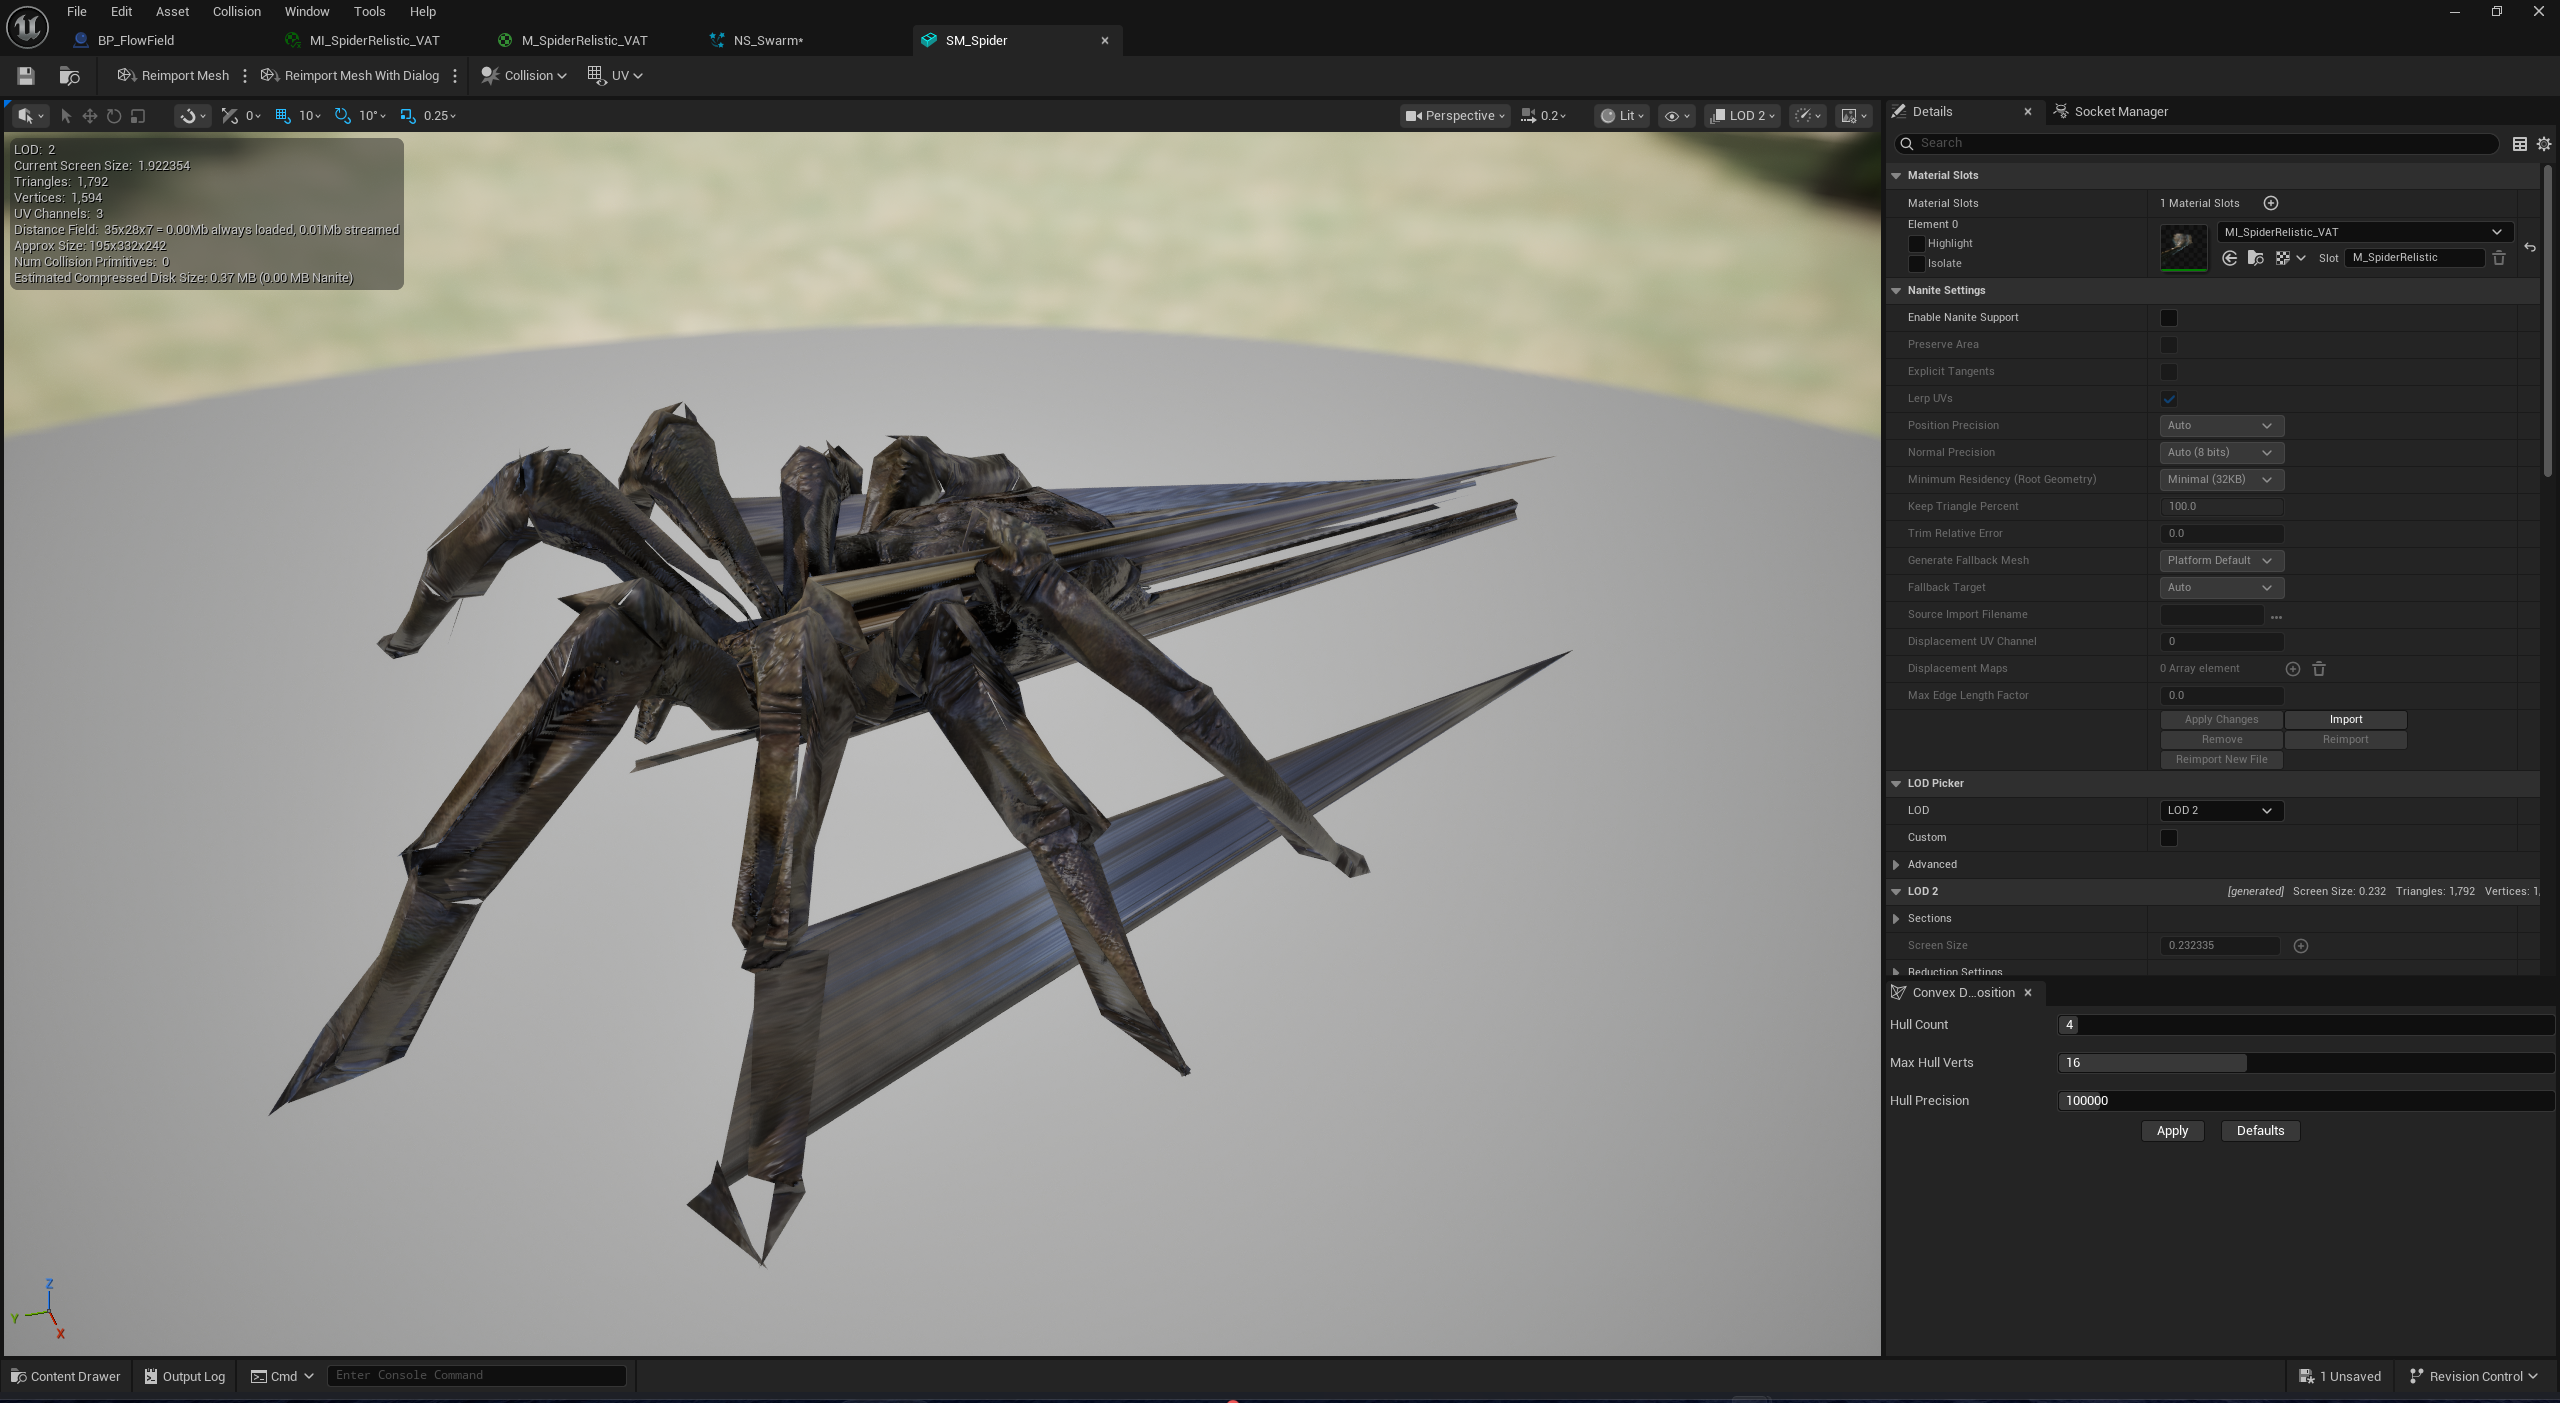
LOD2 has 75% fewer triangles and shows roughly 33% lower GPU time, but the VAT animation stretches. Correct playback may require rebaking VAT for the lower-detail mesh, with animation data matched to that LOD. I would validate deformation and LOD transitions before treating this as an equal-quality improvement.

View mesh limitation
LOD2 mesh inspection β€” 1,792 triangles / 1,594 vertices, with visible VAT deformation
02

As particle count increases

From 1K to 20K particles, GPU time rises from 12.23 to 30.95 ms. BasePass grows from 1.69 to 10.63 ms and Velocity from 0.52 to 9.81 ms. Niagara simulation stays between 0.21 and 0.57 ms. In this scene, rendering grows much faster than the measured simulation cost.

Original LOD0 Β· representative screenshot readings in ms
AgentsGPUBasePassVelocityNiagara sim
1,00012.231.690.520.21
5,00016.293.562.540.25
10,00021.335.884.980.30
15,00025.858.247.420.33
20,00030.9510.639.810.57
03

Inside the simulation

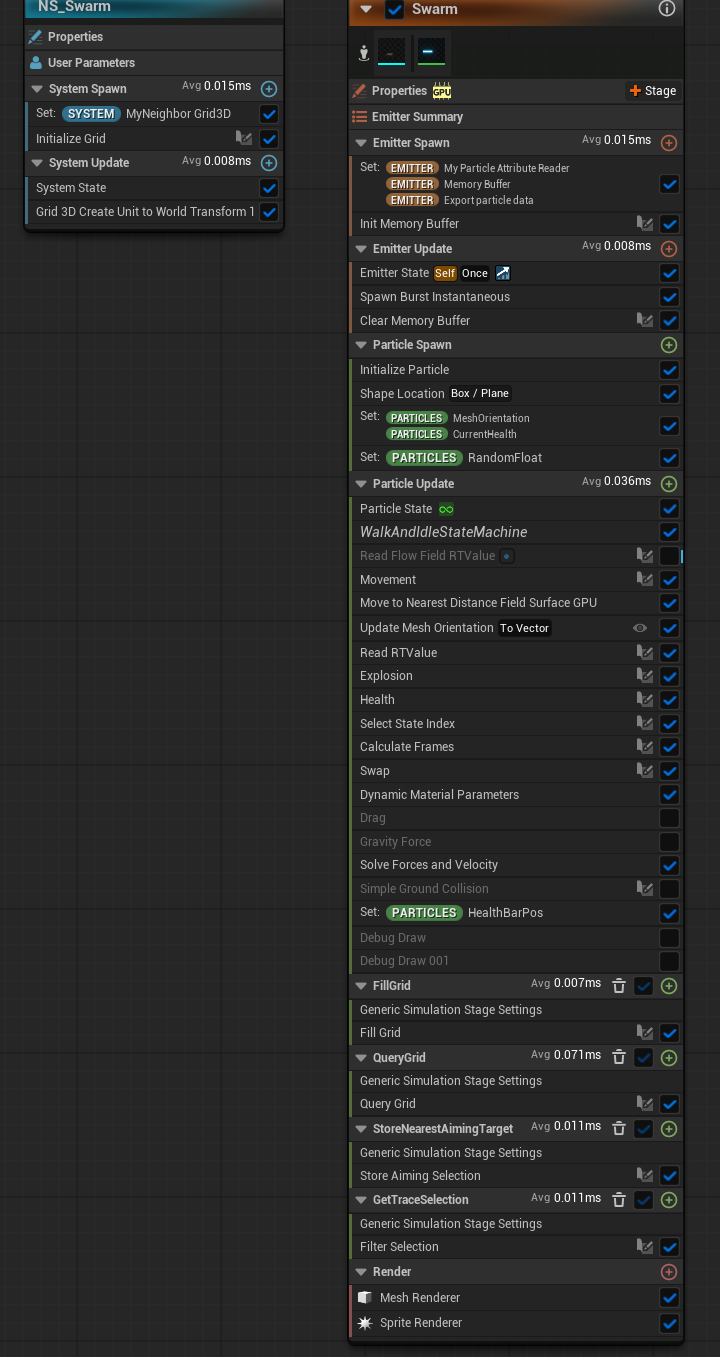
10,000 particles Β· LOD0 Β· Niagara stack timings (Avg, ms)
10,000 particles Β· LOD0 Β· Niagara stack timings (Avg, ms) β†—

QueryGrid takes 0.071 ms, about twice Particle Update at 0.036 msβ€”the highest simulation-stage cost in this capture. My next optimization pass would focus on grid density and query workload, measuring their effect on both timing and swarm behavior.

StageAvg (ms)
QueryGrid0.071
Particle Update0.036
StoreNearestAimingTarget0.011
GetTraceSelection0.011
FillGrid0.007

Separate stack capture Β· stage averages, not individual module timings. CPU System/Emitter scopes and GPU particle timings are measured separately; these values are not the frame-level Niagara total.

What I would change next

I would start with lower-cost meshes and VAT-compatible LODs, then test distance culling and shadows. QueryGrid is the next place to look within the simulation. The LOD2 result needs a deformation fix before I can treat it as a usable improvement.

Tools

Technical stack.